
- Home >
- Stock Photos >
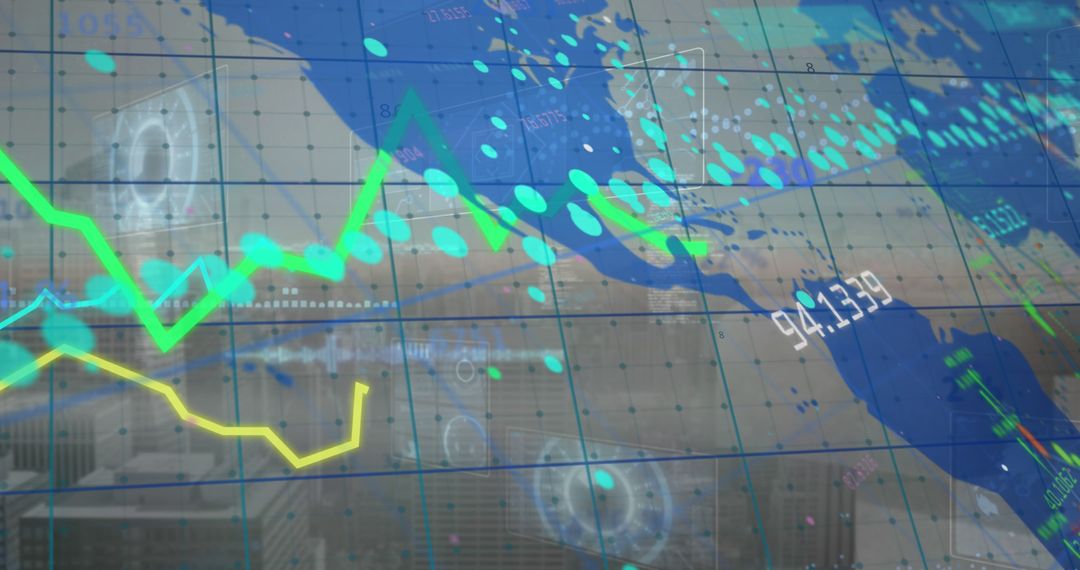
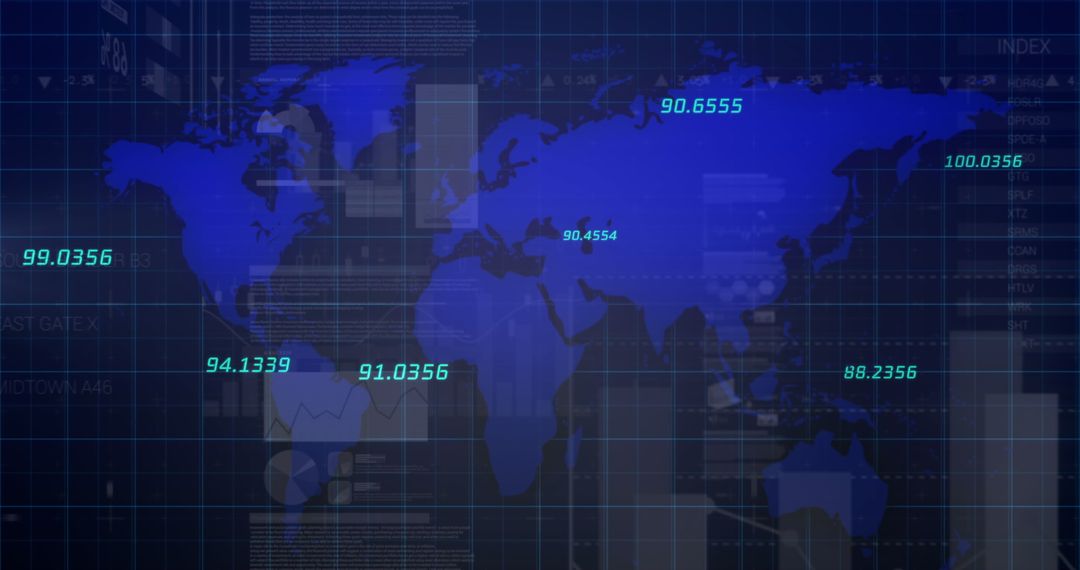
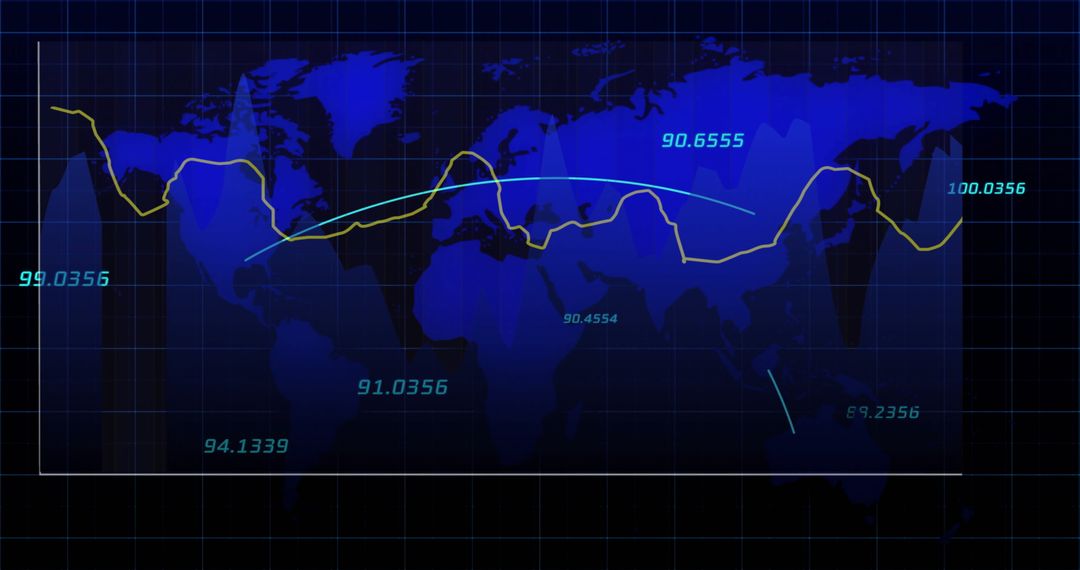
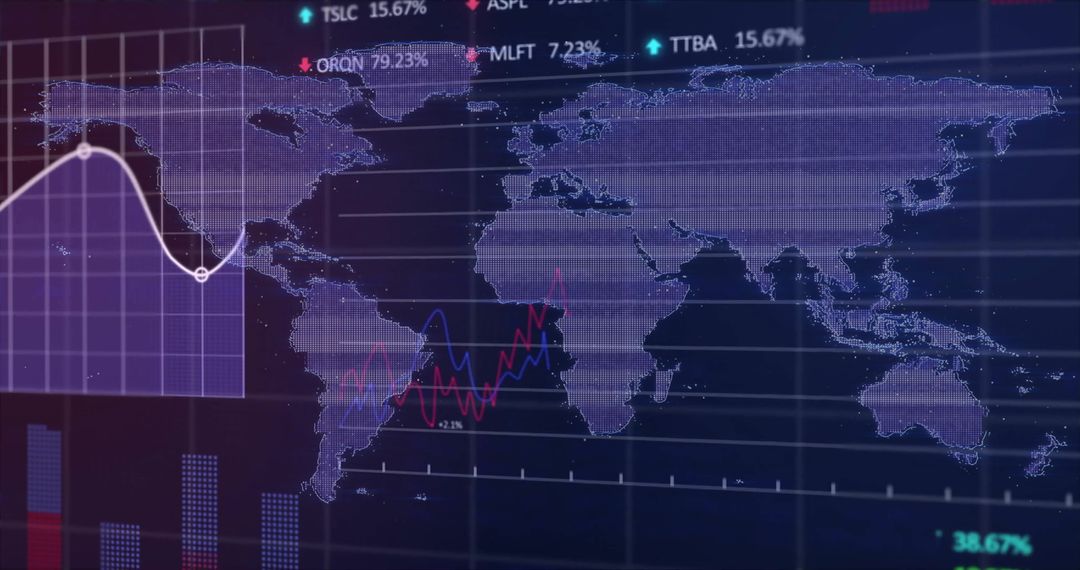
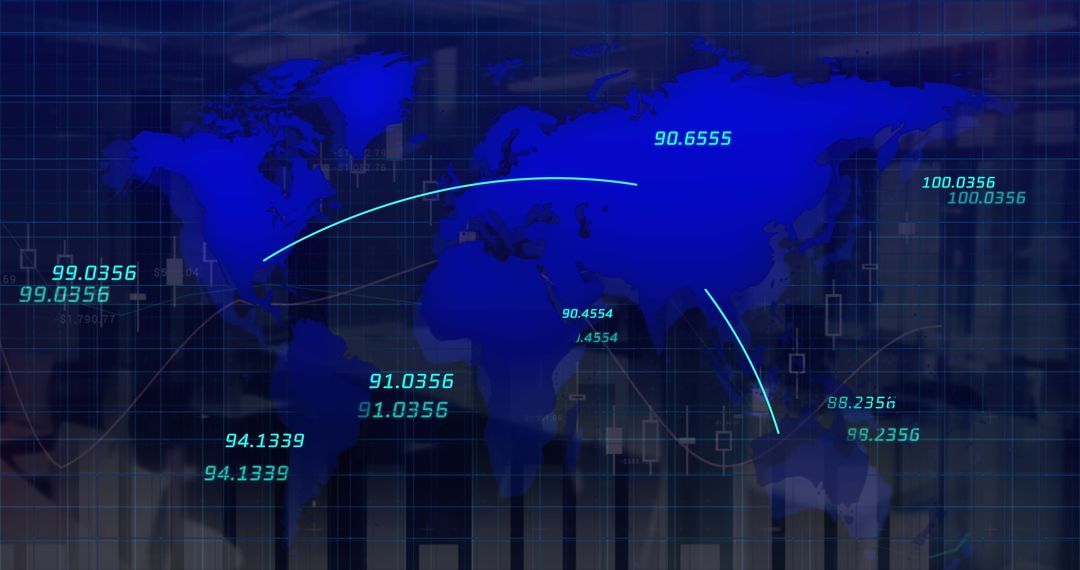
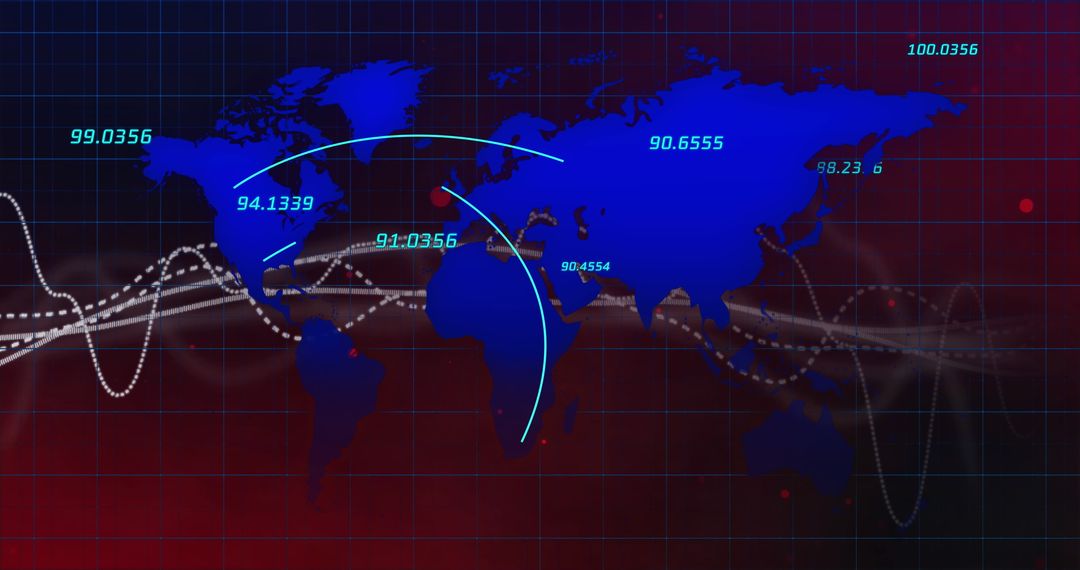
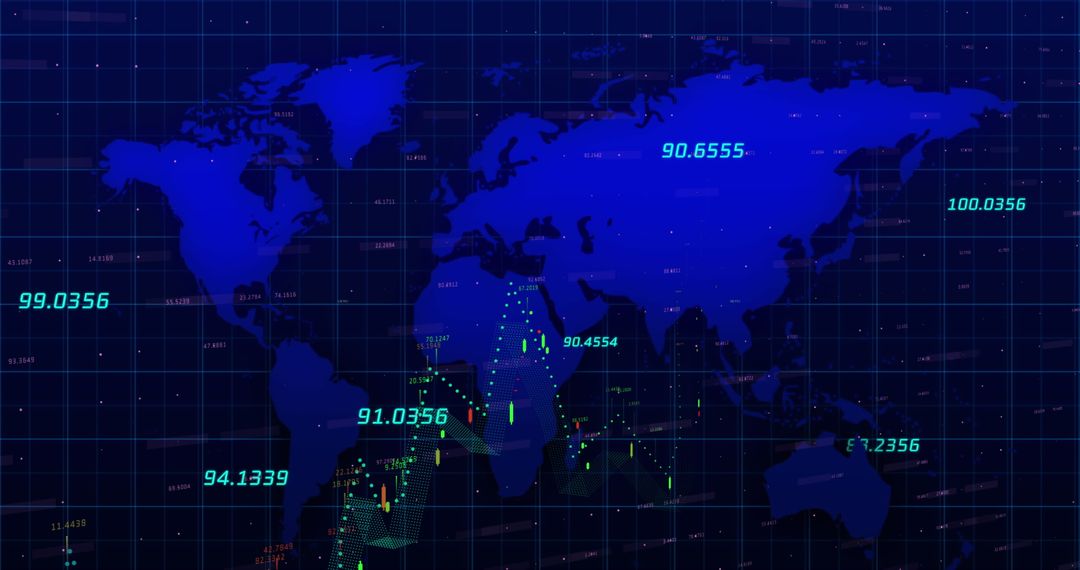
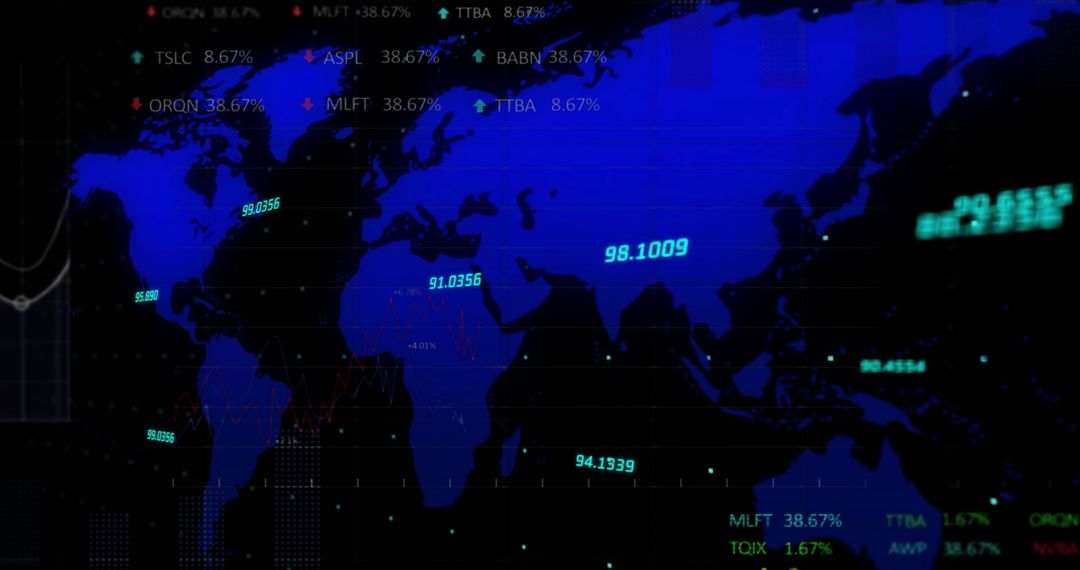
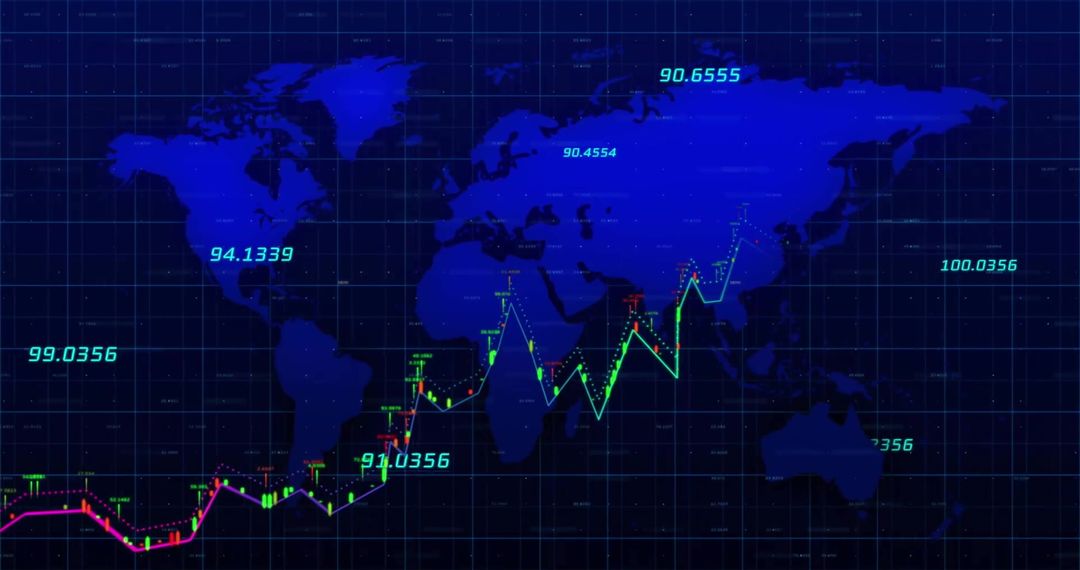
- Digital World Map Showcasing Global Financial Market Trends
Digital World Map Showcasing Global Financial Market Trends Image

Digital world map illustrates global data analytics and financial market trends. It features graphs, numerical data, and marked locations representing different regions. Useful in presentations on finance, technology, globalization, economic trends, and data-driven business strategies.
Powered by 


0
downloads
downloads
Tags:
More
Credit Photo
If you would like to credit the Photo, here are some ways you can do so
Text Link
photo Link
<span class="text-link">
<span>
<a target="_blank" href=https://pikwizard.com/photo/digital-world-map-showcasing-global-financial-market-trends/4db5acf4fcae17a2ac5d90230715a924/>PikWizard</a>
</span>
</span>
<span class="image-link">
<span
style="margin: 0 0 20px 0; display: inline-block; vertical-align: middle; width: 100%;"
>
<a
target="_blank"
href="https://pikwizard.com/photo/digital-world-map-showcasing-global-financial-market-trends/4db5acf4fcae17a2ac5d90230715a924/"
style="text-decoration: none; font-size: 10px; margin: 0;"
>
<img src="https://pikwizard.com/pw/medium/4db5acf4fcae17a2ac5d90230715a924.jpg" style="margin: 0; width: 100%;" alt="" />
<p style="font-size: 12px; margin: 0;">PikWizard</p>
</a>
</span>
</span>
Free (free of charge)
Free for personal and commercial use.
Author: People Creations
Similar Free Stock Images

Premium


Premium


Premium


Premium


Premium


Premium


Premium


Premium


Premium


Premium


Premium


Premium


Premium


Premium


Premium


Premium


Premium


Premium


Premium


Premium


Premium


Premium


Premium


Premium

