- Home >
- Stock Photos >
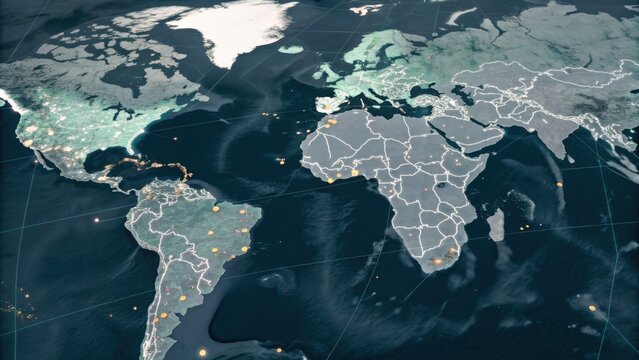
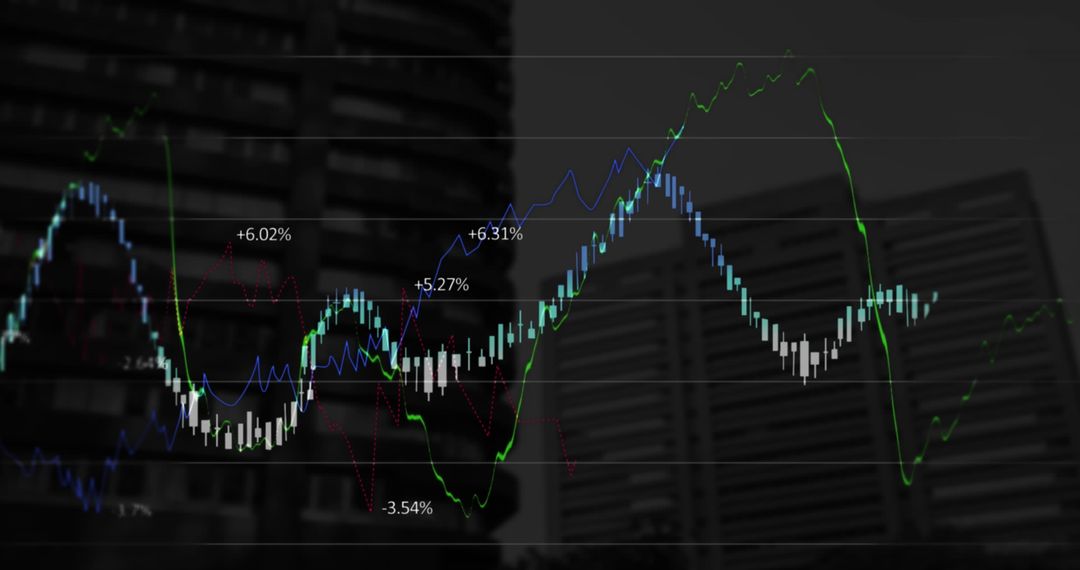
- Digital World Map with Glowing Metrics on Virtual Dashboard
Digital World Map with Glowing Metrics on Virtual Dashboard Image

World map illustration overlayed with glowing metrics provides a modern look, ideal for data analytics, financial insights, or global technology. Suitable for presentations, articles on data visualization, or tech innovation campaigns, emphasizing connectivity and insights.
Powered by 


0
downloads
downloads
Tags:
More
Credit Photo
If you would like to credit the Photo, here are some ways you can do so
Text Link
photo Link
<span class="text-link">
<span>
<a target="_blank" href=https://pikwizard.com/photo/digital-world-map-with-glowing-metrics-on-virtual-dashboard/75960b6ae3bdde653d4db3ae3fa365fd/>PikWizard</a>
</span>
</span>
<span class="image-link">
<span
style="margin: 0 0 20px 0; display: inline-block; vertical-align: middle; width: 100%;"
>
<a
target="_blank"
href="https://pikwizard.com/photo/digital-world-map-with-glowing-metrics-on-virtual-dashboard/75960b6ae3bdde653d4db3ae3fa365fd/"
style="text-decoration: none; font-size: 10px; margin: 0;"
>
<img src="https://pikwizard.com/pw/medium/75960b6ae3bdde653d4db3ae3fa365fd.jpg" style="margin: 0; width: 100%;" alt="" />
<p style="font-size: 12px; margin: 0;">PikWizard</p>
</a>
</span>
</span>
Free (free of charge)
Free for personal and commercial use.
Author: Creative Art
Similar Free Stock Images

Premium


Premium


Premium


Premium


Premium


Premium


Premium


Premium


Premium


Premium


Premium


Premium


Premium


Premium


Premium


Premium


Premium


Premium


Premium


Premium


Premium


Premium


Premium


Premium