
- Home >
- Stock Photos >
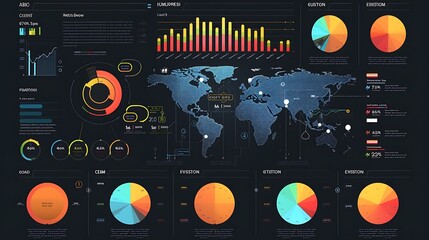
- Digital World Map with Pie Chart on Gradient Background
Digital World Map with Pie Chart on Gradient Background Image

This conceptual design combines a digital world map with a pie chart overlay. The illustration symbolizes data analysis, global business, and technology trends against a gradient blue background. Useful for websites, presentations, and reports focused on statistics, analytics, or global economic insights. Ideal for conveying complex information in visually engaging ways.
Powered by 


downloads
Tags:
More
Credit Photo
If you would like to credit the Photo, here are some ways you can do so
Text Link
photo Link
<span class="text-link">
<span>
<a target="_blank" href=https://pikwizard.com/photo/digital-world-map-with-pie-chart-on-gradient-background/da91ec22f4afd010e3bac7186ecfdac7/>PikWizard</a>
</span>
</span>
<span class="image-link">
<span
style="margin: 0 0 20px 0; display: inline-block; vertical-align: middle; width: 100%;"
>
<a
target="_blank"
href="https://pikwizard.com/photo/digital-world-map-with-pie-chart-on-gradient-background/da91ec22f4afd010e3bac7186ecfdac7/"
style="text-decoration: none; font-size: 10px; margin: 0;"
>
<img src="https://pikwizard.com/pw/medium/da91ec22f4afd010e3bac7186ecfdac7.jpg" style="margin: 0; width: 100%;" alt="" />
<p style="font-size: 12px; margin: 0;">PikWizard</p>
</a>
</span>
</span>
Free (free of charge)
Free for personal and commercial use.
Author: Awesome Content
Similar Free Stock Images

Premium


Premium


Premium


Premium

Premium

Premium

Premium


Premium


Premium

Premium

Premium


Premium

Premium

Premium


Premium

Premium

Premium

Premium

Premium


Premium


Premium

Premium


Premium


Premium


Premium

Explore More Free Stock Images