- Home >
- Stock Photos >
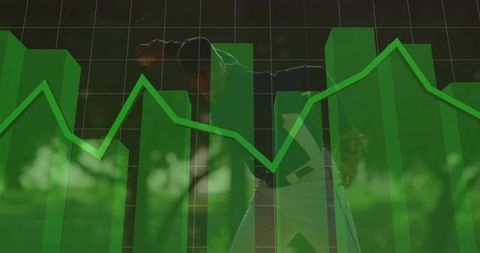
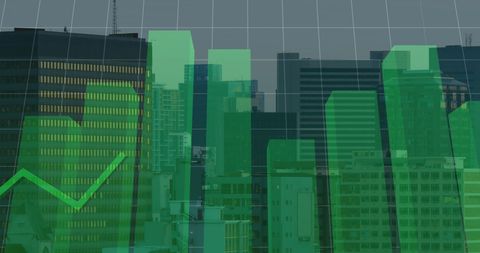
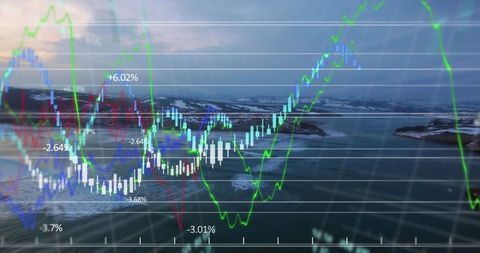
- Digitally Enhanced Financial Stock Market Chart with Green Trends
Digitally Enhanced Financial Stock Market Chart with Green Trends Image
A dynamic depiction of financial activity with green-filled peaks indicating market inclines intermixed with various percentages. Ideal for articles or presentations on investment strategies, stock market reviews, financial forecasts, or business analysis pieces.
Powered by 


2
downloads
downloads
Tags:
More
Credit Photo
If you would like to credit the Photo, here are some ways you can do so
Text Link
photo Link
<span class="text-link">
<span>
<a target="_blank" href=https://pikwizard.com/photo/digitally-enhanced-financial-stock-market-chart-with-green-trends/42e879a422a1478ebdd3e920bdd199be/>PikWizard</a>
</span>
</span>
<span class="image-link">
<span
style="margin: 0 0 20px 0; display: inline-block; vertical-align: middle; width: 100%;"
>
<a
target="_blank"
href="https://pikwizard.com/photo/digitally-enhanced-financial-stock-market-chart-with-green-trends/42e879a422a1478ebdd3e920bdd199be/"
style="text-decoration: none; font-size: 10px; margin: 0;"
>
<img src="https://pikwizard.com/pw/medium/42e879a422a1478ebdd3e920bdd199be.jpg" style="margin: 0; width: 100%;" alt="" />
<p style="font-size: 12px; margin: 0;">PikWizard</p>
</a>
</span>
</span>
Free (free of charge)
Free for personal and commercial use.
Author: People Creations
Similar Free Stock Images
Loading...
Premium


Premium


Premium


Premium

Premium

Premium


Premium


Premium

Premium

Premium


Premium


Premium


Premium

Premium


Premium

Premium


Premium


Premium


Premium


Premium


Premium


Premium


Premium


Premium


Premium