1. Home > 
  2. Stock Photos > 
  3. Digitally Enhanced World Map with Data Analysis Overlay

Digitally Enhanced World Map with Data Analysis Overlay Image

Digitally Enhanced World Map with Data Analysis Overlay

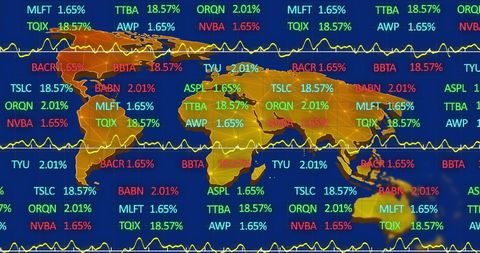
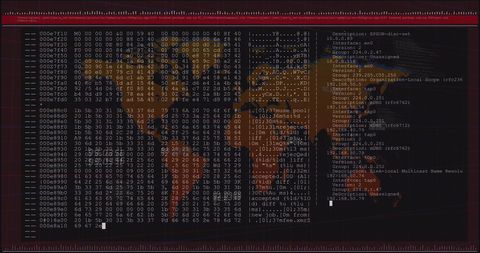
The visual showcases a world map overlayed with digital grids displaying various numerical data. The futuristic design suggests a setting fit for technologies related to global analytics, smart command centers, or high-tech information ecosystems. Useful for publications on data science, technology trends, global insights, and innovation, suited for web designs or editorial content highlighting advanced technological themes.

Powered by Shutterstock logo - Get 15% off with code: PIKWIZARD15
AI, Big Data, and business analytics icons represent the integration of advanced technology in analyzing graphs, business data, and market trends, driving strategic decisions and innovative solutions. - Powered by Shutterstock - Get 15% off with code: PIKWIZARD15Analyst working with Business, Concept digital transformation technology strategy, Analytics and Data Management System on computer, make a report with KPI and metrics connected to database. - Powered by Shutterstock - Get 15% off with code: PIKWIZARD15AI, Big Data, and business analytics icons represent the integration of advanced technology in analyzing graphs, business data, and market trends, driving strategic decisions and innovative solutions. - Powered by Shutterstock - Get 15% off with code: PIKWIZARD15Big data technology and data science with person touching data flowing on virtual screen. Business analytics, artificial intelligence, machine learning. Engineer or scientist analyzing stream of data. - Powered by Shutterstock - Get 15% off with code: PIKWIZARD15AI-Driven Workflow, Automating Data Management Analytics and Business Reports with KPIs, Predictive Insights, and Big Data Integration. Businessman touching Virtual Screen with Decision-Making Tech. - Powered by Shutterstock - Get 15% off with code: PIKWIZARD15

Credit Photo

If you would like to credit the Photo, here are some ways you can do so

Free (free of charge)

Free for personal and commercial use.

Author: Creative Art

Similar Free Stock Images

Illustrated Europe Map with Data Insights for Political Analysis
Premium
Analyst working with Business Analytics and Data Management System on computer to make report with KPI and metrics connected to database. Corporate strategy for finance, operations, sales, marketing
Dynamic Stock Market Charts with Financial Data
Global Financial Markets Overlaid on World Map Showcasing Stock Data
Digital World Map with Global Financial Technology
Digital Financial Data Processing on Global Map Interface
Premium
Internet cyberspace data information collection analytical statistics computer storage ai artificial intelligence calculation, blue background banner copyspace.
Digital Data Processing Overlay on Dynamic Cityscape
Visualized Financial and Data Analysis with Coding Elements
World Map with Stock Market Data and Statistical Analysis
Cybersecurity Breach with Hacked Digital Interface
Premium
Analyst working with Financial Data and Business Analytics Dashboard on computer to make Financial Report with KPI and Metrics. Investment, Corporate Finance, Strategy, Operations, Sales.
Digital Stock Market Graph with Data in Blue
Global Data Visualization on Digital World Map
Stock Market Data Overlay with Businesswoman in Background
Financial Data Processing Display with Digital Grid Background
Premium
Stock graph and financial chart. Analyze stock market finance volume of stock market with Graph and chart holograph technology. High quality photo
Digital World Map with Financial Data Visualizations
Digitized Stock Market Data Shows Fluctuating Percentages and Financial Graphs
Global Financial Data Analysis with World Map Overlay and Percent Symbols
Digital Financial Chart with Tickers and Percentage Analytics
Premium
Big Data concept. Digital neural network.Business woman hand touching Introduction of artificial intelligence. Cyberspace of future.Science and innovation of technology.
Global Financial Data and Digital Analytics Visualization
Futuristic Digital Interface with Alphanumeric Grid
Digital Stock Market Grid Display Showcasing Real-Time Financial Data
Global Stock Tickers with Percentages on Digital Map Interface
Premium
A businessman uses a laptop to access an AI-powered business analytics dashboard, showcasing charts, metrics, and KPIs. He analyzes performance data to generate. Data analysis concept.
Futuristic Cybersecurity Digital World Map with Code Interface
Digital World Map with Neon Data Charts
Futuristic Technology Map Interface with Hexagonal Grid and Data Points
Red Globe on Digital Control Panel with Error Codes and Years Timeline
Data Visualization with Worldwide Digital Insights
Stock Market Data Interface Analyzing Global Economy
Premium
Data science, business analysis and strategy, big data concept.Business teamwork analyzing financial graph on virtual touch screen, futuristic technology solution for business development
Digital Display Showing Stock Market Values and Data Analytics
Digital Interface Displaying Stock Market Data and Graphs
Global Business Finances on Digital Map
Global Fintech Data Stream Overlay on World Map
Premium
Two diverse crypto traders brokers stock exchange market investors discussing trading charts research reports growth using pc computer looking at screen analyzing invest strategy, financial risks.
Futuristic Digital Stock Market Display with Dynamic Data Visualization
Global Financial Data on Digital Web Display
Digital Code with World Map Background in Terminal Interface
Data Processing Interface Over World Map in Blue
Premium
A digital interface shows data visualizations and analytics being interacted with on a laptop, highlighting technology and data analysis.
Global Stock Market Trends Over Digital World Map
Dynamic Financial Data Analysis and Graphs for Market Trends
Global Financial Data and Network Visualization on World Map
Abstract Financial Data and Analytics Background
Premium
Data analytics automated with AI technology. Businessman use laptop and dashboard for Automating Data Management Analytics and Business Reports with KPI. Database. Sales. Marketing. AI chat bot.
Digital Stock Market Interface Displaying Fluctuating Percentages
Global Digitized World Map with Data Interface Elements
Renewable Energy and Global Market Analysis with Digital Interface
Digital World Map and Data Processing Concept on City Background
Premium
Business finance data analytics graph chart report, man using laptop computer hand typing investment data digital marketing KPI sale report, financial management technology, cyber space metaverse.
Global Financial Market Trends with Stock Tickers and Percentages
Abstract Digital Analytics Dashboard with Data Visualization Elements
Financial Market Analytics on Digital Screen With Trend Lines
Currency Exchange Rates Display on Digital Screen with Analytics
Premium
Analytics Finance and Business concept. Big data analytics and business intelligence BI.
Futuristic Digital Helix over World Map Interface
Market Analysis Graphs with Dynamic Data on Digital Display
Digital World Map with Artful Data Overlay and Analytics Elements
Stock Market Analysis with Financial Data Indicators
Finance Graph Over Digital Interface with Basic Shapes and Numbers
Real-Time Stock Market Data Interface with Declining Trend
Premium
Banking business, finance and investment concept. Businessman analyzing market data, financial graph report, economic growth, business strategy, planning and solution, risk management
Global Financial Network Data Processing With World Map Overlay
Data Analysis Graphics on World Map Background
Businessman Analyzing Global Financial Market Data on Laptop
Global Financial Data Analysis with Digital Screen Interface
Premium
Data analytics automated with AI technology. Big data, business analytics and artificial intelligence automation. Dashboard report with sales and operations charts and KPI insights on touch screen.
Abstract Stock Market Data Analyzed on Digital Grid
Global Cybersecurity Concept with Programming Language and World Map
Digital Stock Market Data and Financial Charts Algorithm
Global Financial Data Over Digital World Map Visualization
Premium
Big data technology and data science. Data scientist querying, analysing and visualizing complex information on virtual screen. Data flow concept. Business analytics, finance, neural network, AI, ML.
Financial Data Visualization with Dynamic Graphs and Charts
Data Table with Numerical Values Over Abstract Red Geometric Background
Abstract Digital Data Network Interface with Overlays
Digital Interface with Currency Symbols and Data Analytics
Premium
Black woman working in office and futuristic graphical user interface concept. ICT (Information Communication Technology). System engineering.
Financial Data Overlay on World Map Indicating Global Trends
Financial Data Analysis Over Digital World Map
Global Network Future Concept with Digital Question Marks
Global Financial Data Visualization with Stock Market Chart
Premium
Health Insurance, telemedicine, virtual hospital, family medicine concept. Doctor using laptop computer with health care icons, medical technology background, health insurance business
Futuristic Cloud Synchronization Icon with Encrypted Code Background
Financial Indicator Surging on Global Market Data Display
Digital World Map Interface with Futuristic Data Visualization
Financial Dashboard with Stock Ticker Symbols and World Map
Premium
Finance analyst working on business analytics and data management system to make financial report with business performance, KPI dashboard. Corporate strategy for finance, digital marketing plan
Digital Currency Exchange Rates Interface on Trading Screen
Pandemic Impact on Financial Markets Visualization with Virus and Mask Icons
Financial Data Through Digital Networks with Stock Market Growth Trend
Digital Financial Data Display with Global Focus
Dynamic Stock Market Data Display with Digital Graph
Global Data Processing and Digital Interface Over World Map
Premium
A businessman uses a laptop to access an AI-powered business analytics dashboard, showcasing charts, metrics, and KPIs. He analyzes performance data to generate. Data analysis concept.
Global Digital Analytics Data Flow on World Map Background
Digital Data and Cityscape Integration for Global Business
Global Data Processing Concepts with Digital Interface
Dynamic Stock Market Data with Digital Analysis Grid Concept
Premium
Big data analysis with AI technology for business analytics. Insights from data mining, filtering, sorting, clustering. Data scientist working on machine learning on virtual computer screen.
Digital Data and Stock Market Display Background
Digital Interface with Dynamic Business Data Analytics
Digital Financial Data with Graphs and Numbers Illustrations
Fluctuating Stock Market Graph with Symbols and Percentages
Premium
Male mature caucasian ceo businessman leader with diverse coworkers team, executive managers group at meeting. Multicultural professional businesspeople working together on research plan in boardroom.
Global Stock Market Data Visualized on World Map
Digital Data Visualization with Statistics and Global Maps
Futuristic World Map with Digital Data Overlay Against Urban Skyline
Digital Data Overlay on World Map and City Skyline
Premium
Business man computer hand close up futuristic cyber space finance AI chatbot artificial coding coding background business data analytics programming online network metaverse digital world technology
Interactive Financial Graphs Displaying Market Trends and Data
Futuristic Digital World Map with Global Network Connection
Futuristic Digital Interface with Financial Data and Analytics
Global Financial Market Charts with Statistics and Indicators
Premium
Big data sphere visualization with text. HUD wireframe mesh sphere with dot and lines. Visual data infographics design. Science technology. Digital Data. Analysis of information.
Futuristic Stock Market Ticker Display with Global Data Analytics
Digital Data Grid Interface with Futuristic Visualization
Futuristic World Map with Digital Data Overlay for Analytics
Global Financial Data with World Map and Ticker Overlay
Premium
Analyst working with computer in Business Analytics and Data Management System with KPI and metrics connected to the database for technology finance, operations, sales, marketing. Data analysis.Ai
Global cybersecurity dashboard showing terminal code, encryption and world map overlay