- Home >
- Stock Photos >
- Digitally Generated Data Processing Visualization
Digitally Generated Data Processing Visualization Image

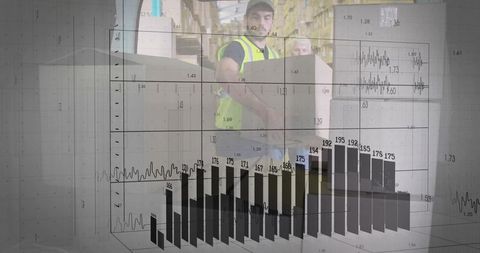
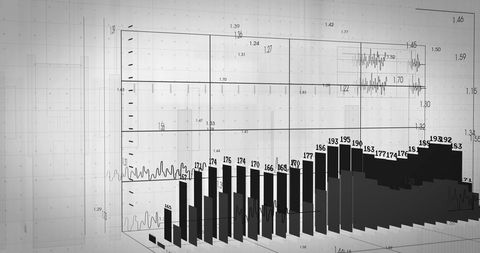
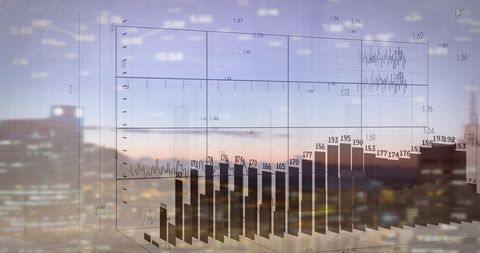
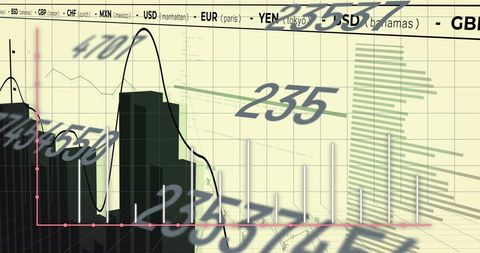
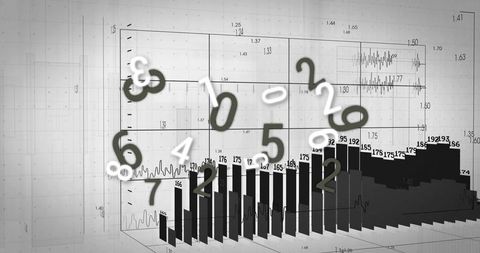
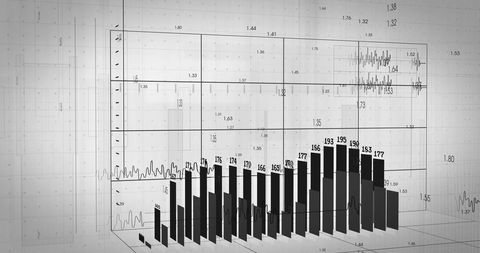
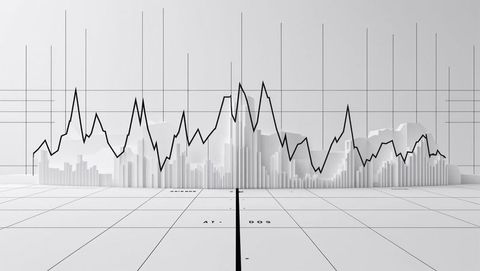
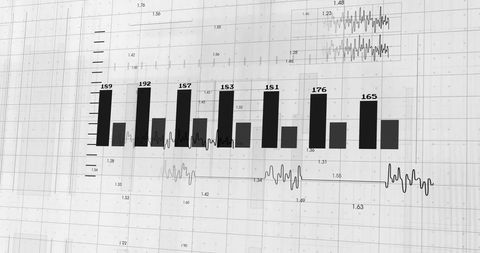
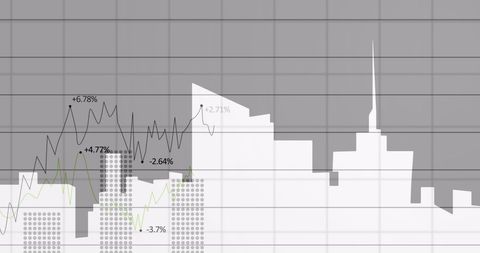
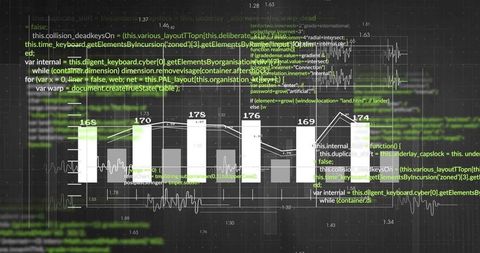
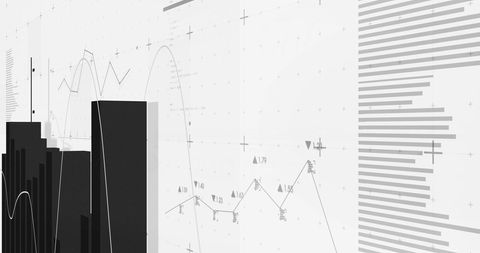
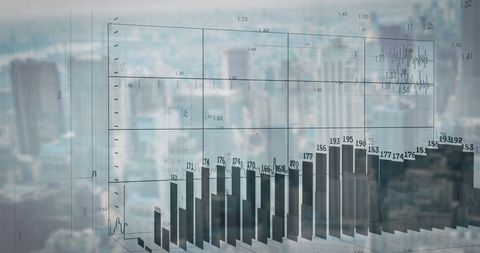
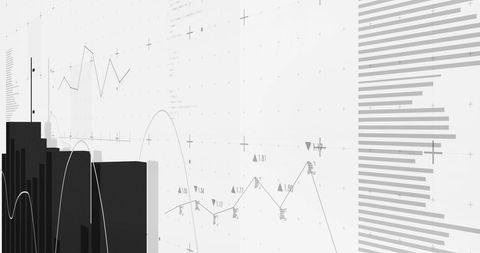
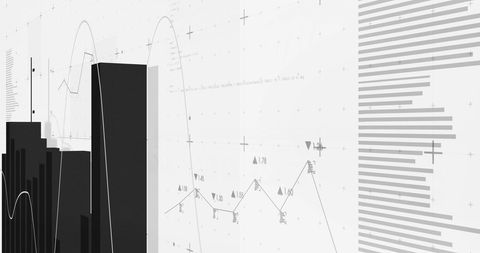
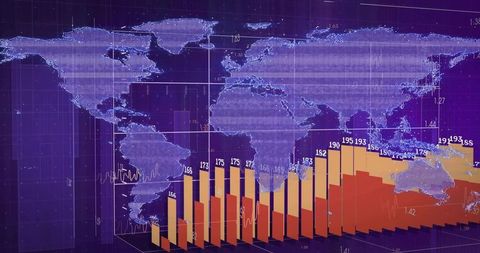
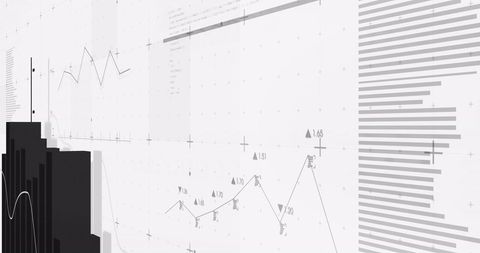
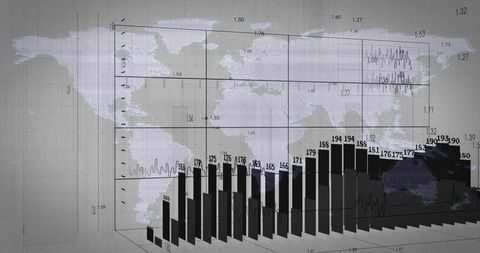
Artwork displays a complex array of data, numbers, and diagrams on a white background, representing the intersection of digital technology, finance, and global business. Useful for illustrating concepts in data analytics, business reports, or technology articles and blogs.

downloads
Tags:
More
Credit Photo
If you would like to credit the Photo, here are some ways you can do so
Text Link
photo Link
<span class="text-link">
<span>
<a target="_blank" href=https://pikwizard.com/photo/digitally-generated-data-processing-visualization/961a47277cba8a9dfa7d80abc2a9567a/>PikWizard</a>
</span>
</span>
<span class="image-link">
<span
style="margin: 0 0 20px 0; display: inline-block; vertical-align: middle; width: 100%;"
>
<a
target="_blank"
href="https://pikwizard.com/photo/digitally-generated-data-processing-visualization/961a47277cba8a9dfa7d80abc2a9567a/"
style="text-decoration: none; font-size: 10px; margin: 0;"
>
<img src="https://pikwizard.com/pw/medium/961a47277cba8a9dfa7d80abc2a9567a.jpg" style="margin: 0; width: 100%;" alt="" />
<p style="font-size: 12px; margin: 0;">PikWizard</p>
</a>
</span>
</span>
Free (free of charge)
Free for personal and commercial use.
Author: People Creations