1. Home > 
  2. Stock Photos > 
  3. Digitally Generated Financial Data Analysis with Dynamic Charts

Digitally Generated Financial Data Analysis with Dynamic Charts Image

Digitally Generated Financial Data Analysis with Dynamic Charts

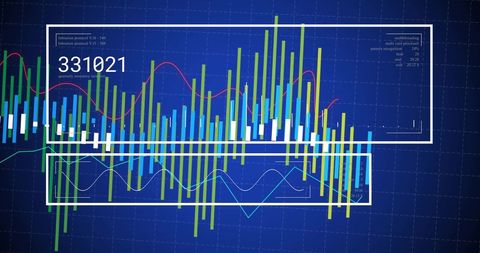
Visual focusing on financial data, featuring dynamic bar and line charts against a blue backdrop, ideal for illustrating concepts in finance, analytics, and online security. Useful for financial presentations,educational materials,business website content showing real-time data processing capabilities.

Powered by Adobe logo
Hands interact with digital charts, highlighting financial growth and market trends. The image represents data analysis in a modern business setting and encourages insights. Copula - Powered by AdobeBusiness analysis reports with charts and graphs. Integrated content management platform. Digital document automation. Businessperson holding reports. - Powered by AdobeVibrant workspace showcasing data analysis with colorful charts and graphs on a large digital dashboard display - Powered by AdobeBig data and AI technology, Business intelligence and AI data science, Automating data processing, Machine learning and business intelligence, AI driven data processing, KPI performance monitoring. - Powered by AdobeBusinesswoman working on laptop with analytics graphs displayed on screen inside warehouse. Concept of logistics, supply chain, inventory management, shipping, ecommerce and distribution. - Powered by Adobe

Credit Photo

If you would like to credit the Photo, here are some ways you can do so

Free (free of charge)

Free for personal and commercial use.

Author: People Creations

Similar Free Stock Images

Dynamic Financial Graph with Wavy Data Line over Navy Background
Premium
Modern digital background with various data visualization charts including bar graphs, pie charts, and line graphs, representing business analytics and financial data.
Digital Financial Data on Server with Stock Market Graph
Premium
Futuristic digital dashboard displays business growth metrics. Data visualization shows product lifecycle, market launch, end-of-life performance. Technology concept with chart graphs, cyber space
Premium
Futuristic holographic data hub with glowing blue towers and floating analytical dashboards displaying charts and graphs.
Abstract Financial Graph Illustration on Dark Background
Digital Data Processing with Chart in Futuristic Interface
Digital Financial Graph on Green Background Showing Rising Trends
Global Data Analytics Over World Map with Numeric Statistics
Cityscape with Digital Stock Market Graphs and Statistics
Futuristic Digital Data Analytics Interface Display
Glowing Data Lines on Financial Graph Grid Background
Premium
AI data analytics dashboard, business data insights, AI-powered data analysis dashboard, business strategy, Analyst or Scientist uses a computer and dashboard for analysis of information development
Dynamic Graphs Overlay on Data Center Servers Illustrating Technology Impact
Futuristic Digital Data Visualization on Blue Background
Data Visualization with Rising Red Arrow and Floating Numbers
NFT Financial Data Visualization with Digital Graph Overlay
Premium
Man analyzes financial charts on multiple computer screens. He studies digital data, graphs, and performance metrics for business strategy and planning.
Financial Data Processing with Green Digital Graph in Action
Financial Graph Analysis on Green Grid Background
Data Visualization of Financial Market with Dots and Lines
Financial Data Analysis and Digital Interface Concept
Premium
Businessman in suit touching artificial intelligence AI glowing icon with digital interface showing brain analysis data charts and puzzle pieces for smart business technology solution
Colorful Data Visualization on Dark Background
Stagflation Concept with Fluctuating Financial Graph and Data
Digital Interface Showing Global Business Data Analytics
Digital Sound Wave with Frequency Bars on Dark Blue Background
Global Stock Market Data Visualization on Digital Map Background
Futuristic Digital Graph Showing Data Trends on Analytic Interface
Dynamic Financial Data Graph on Blue Digital Background
Financial Growth Stock Nikkei in Urban City Skyline
Premium
A high-tech control room with digital displays showcasing financial data and analytical insights. The image shows several monitors displaying graphs and charts, creating a dynamic visual
Glowing Financial Graph of Stock Market Trends on Digital Screen
Futuristic Digital Representation of DNA Strand
Artificial Intelligence with Futuristic Digital Interface Design
Dynamic Financial Graph in Virtual Red Grid Background
Digital Graph Display with Dynamic Flux on Purple Background
Digital Earth with Data Visualization and Network Connectivity
Premium
Man wearing augmented reality glasses analyzes futuristic digital data market trends and financial charts
Digital Stock Market Graph with Floating Numeric Data
Dynamic Digital Data Visualization with Dot Graph Design
Premium
Vast amounts of complex data displayed on a glowing computer screen for analysis
Digital Data Processing with Graph and Grid Technology Interface
Financial Data Graph Rendering Global Market Trends
Digital Data Wave with Floating Numeric Values on Black Background
Rising Financial Graph on Dark Grid Background
Stagflation Concept with Financial Data Coding Overlay
Digital Cardiograph on Black Background in Colorful Display
Line Graphs on Digital Background Show Financial Data Trends
Financial Stock Market Data Visualization with Declining Trends
Premium
Businessman holding magnifying glass over digital checkboxes and analytics documents representing data verification and whitelist concept on dark background.
Digital Forex Data Over City Skyline Visualizing Market Trends
Dynamic Financial Graphs Overlaying Urban Skyline
Real-Time Financial Data Analysis with Graphs and Charts
Colorful Bar Graph on Dark Background Illustrates Data Trends
Premium
Magnified fingerprint on financial data
Premium
ecommerce, orders, admin, table, status, fulfill, Hand using digital tablet with ecommerce dashboard showing orders, sales data, charts, and transaction analysis for online business management.
Digital Stock Market Data with Floating Points on Black Background
Digital Graph Displaying Dynamic Data Analysis
Abstract Technology Chart with Blue Dots on Black Background
Dynamic Stagflation Concept Displaying Economic Burdens
Abstract Representation of Financial Data Processing
Graph Lines Portraying Financial Data Trends
Digital DNA Strand Overlaid with Scientific Data Patterns
Dynamic Financial Graph on Purple Background
Premium
Bright light bulb shining on dark background with data processing and financial charts
Financial Data Analysis Vibrant Graphs on Blue Background
Dynamic Data Analysis on Digital Graph, Technology Background
Financial Data Graphics Over World Map in Digital Style
Dynamic Financial Graphs Overlaying Modern Cityscape
Premium
Business analyst working on laptop with holographic dashboard charts and data visualization graphs. Concept of big data, analytics, business intelligence, and financial statistics. crm marketing
Premium
The illustration shows a futuristic digital financial system with glowing displays, microchips, and stacks of currency, representing digital transactions and data processing.
Futuristic Financial Graph with Data Overlays in Blue Holographic Style
Futuristic Data Analytics Over Technical Blueprint Design
Rising Graph with Digital Data Interface Analysis
Financial Data Analysis with Futuristic Technology Interface
Premium
Businessperson using digital smartphone and laptop to manage global tax system. Concept of online tax filing, financial technology, remote accounting software and international taxation management.
Premium
A robotic hand interacts with dynamic financial charts, showcasing market growth and data analysis in a high-tech digital environment, symbolizing innovation.
Abstract Financial Graph with Rising Waves on Red Gradient
Global Networking Concept with 6G Technology Display
Dynamic Digital Data Stream with Global Connectivity
Digital Finance Chart Overlaying Globe Background
Premium
A professional interacts with a digital touchscreen displaying various data visualizations, including charts and graphs, to gain business insights and improve performance. Impute
European Market Data Overlay with EU Flag and Financial Graphs
Dynamic Financial Graph on Luminous Green Background
Futuristic Graph with Digital Globe Symbolizing Global Technology Connections
Dynamic Financial Chart with Data Points on Red Grid Background
Economic and Political Factors Influence Investment Trends
Abstract Financial Graph with Bar and Line Charts on Dark Background
Digital Interface with Global Financial Graphs Background
Premium
Abstract 3D data visualization with glowing interface elements and charts
Premium
A professional businessman interacting with a digital interface displaying data analytics and visualizations representing insights and strategic decision making processes
Premium
Data analysis science and big data with AI technology. Analyst or Scientist uses a computer and dashboard for analysis of information on complex data sets on computer. Insights development engineer
Digital Graphs and Data Visualization on Green Background
Dynamic Financial Data Waves in Digital Cyber World
Abstract Digital Blue Dot Graph with Floating Numbers
Data Analysis Signs Stagflation on Costa Rica Flag Concept
Digital Cardiograph Display with Green Line over Black Background
Dynamic Financial Data on Digital Screen
Digital Financial Data Analytics and Trend Graphs
Digital Financial Data Graph Showcasing Market Trends
Data Analytics Graphs on Digital Interface Background
Dynamic Financial Data Chart Showing Trend Analysis
Financial Growth Graph on Green Digital Grid Background
Dynamic Financial Chart with Upward Growth Arrow
Premium
Abstract illustration showcasing financial data analysis with flowing lines charts and graphs in a blue gradient background
Digital Data Visualization with Green Graph and Scanning Beams
Financial Data Analysis with Dynamic Graph on Blue Background
Stagflation Concept with Financial Market Downturn
Dynamic Stock Market Graphs Over Digital Interface
Premium
Project manager using stylus on tablet with hologram Gantt chart schedule interface. Business planning, timeline management, and digital workflow concept for corporate strategy efficiency.
Dynamic Financial Data Visualizations on Grid Interface
Digital DNA and Binary Code Fusion Illustrating Genetics and Data Science
Data Trends and Analysis on 3D Digital Grid
Rising Stock Market Graph on Blue Financial Background
Premium
A holographic bar chart of financial data emerging from a futuristic black device on a dark background
Abstract Digital Data Visualization on Black Background
Falling Line Graph on Navy Background Illustrating Economic Decline
Analyzing Stock Market Trends with Dynamic Graphs and Data
Abstract Digital Finance Chart Showing Fluctuating Graph Lines
Premium
Sales data analysis dashboard showing performance, trends, and insights. Sales data tracks growth, supports decisions, sales data boosts strategy, and sales data drives performance.
Digital Red Wave Graph with Inflation Text and Data
Line Graph Illustrating Data Trend on Green Digital Background
Digital Financial Graph Over Violet Background in Abstract Style
Abstract Financial Graph with Glowing Node on Grid Background
Explore More Free Stock Images