- Home >
- Stock Photos >
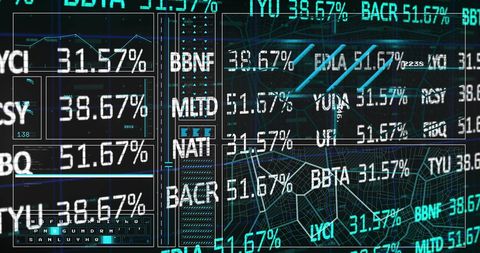
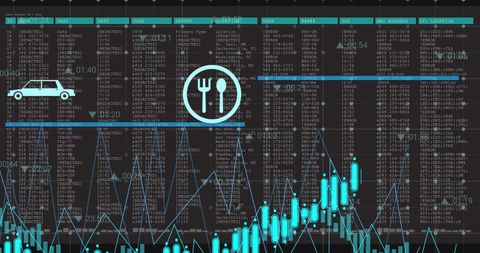
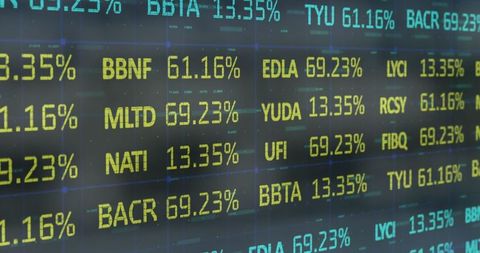
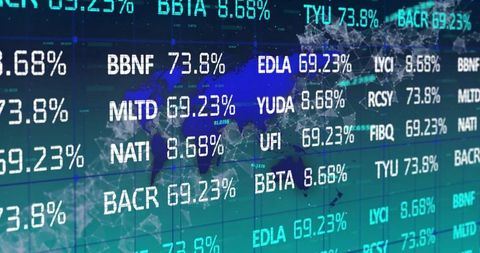
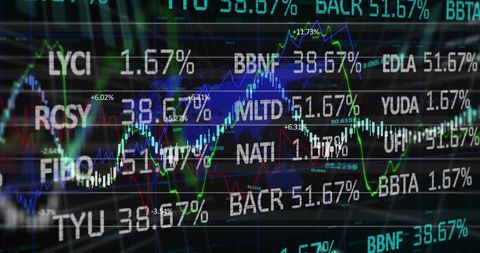
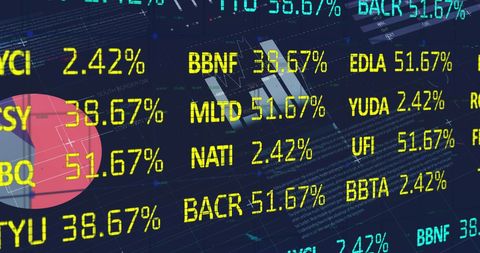
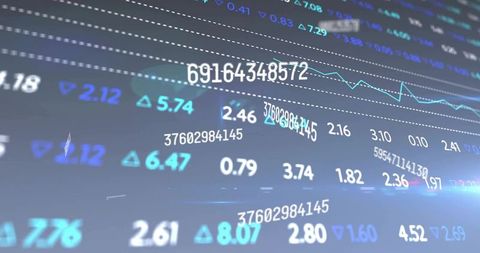
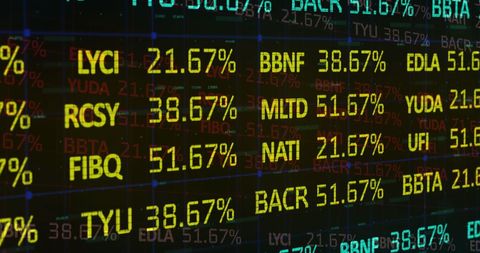
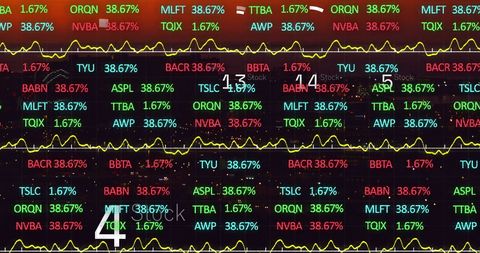
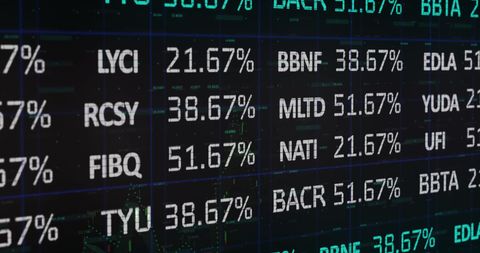
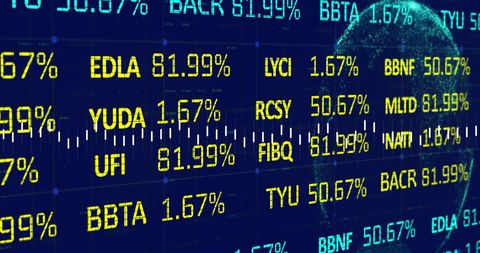
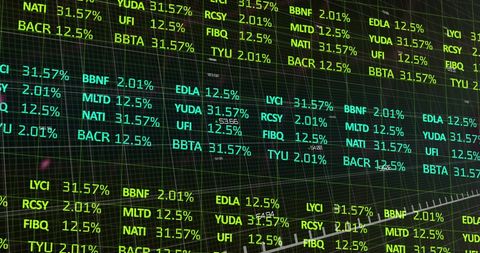
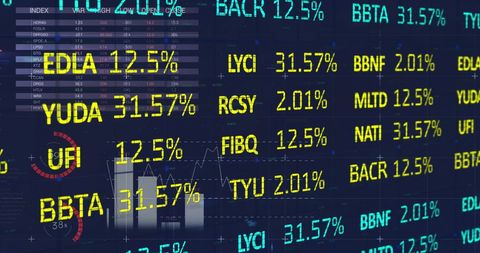
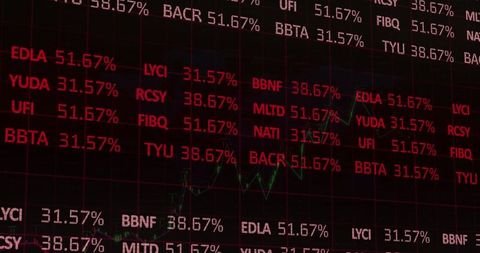
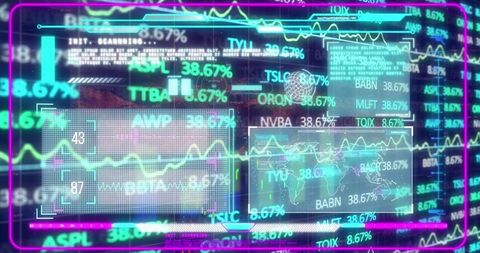
- Digitized Stock Market Data Shows Fluctuating Percentages and Financial Graphs
Digitized Stock Market Data Shows Fluctuating Percentages and Financial Graphs Image

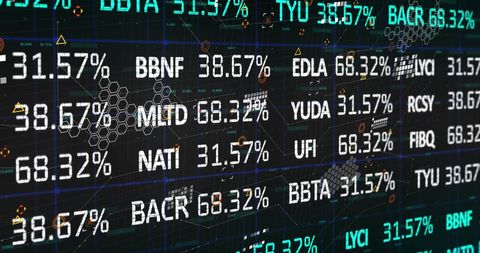
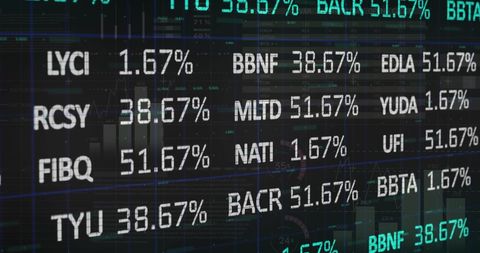
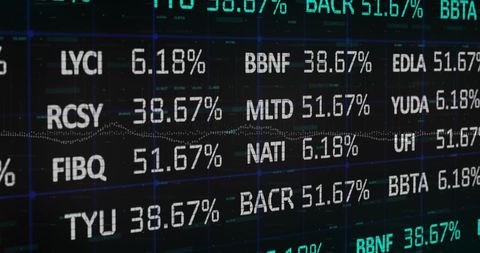
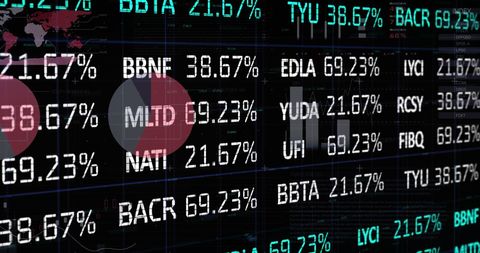
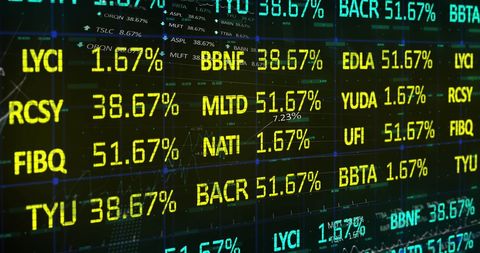
This dynamic visual showcases shifting percentages of stock market data accompanied by complex financial graphs. Useful for illustrating topics related to finance, investment strategies, and economic trends. An ideal representation for financial articles, investment guides, or educational purposes involving stock market analysis.
Powered by 


downloads
Tags:
More
Credit Photo
If you would like to credit the Photo, here are some ways you can do so
Text Link
photo Link
<span class="text-link">
<span>
<a target="_blank" href=https://pikwizard.com/photo/digitized-stock-market-data-shows-fluctuating-percentages-and-financial-graphs/221ba497326a31614b46c0ed50a55ccf/>PikWizard</a>
</span>
</span>
<span class="image-link">
<span
style="margin: 0 0 20px 0; display: inline-block; vertical-align: middle; width: 100%;"
>
<a
target="_blank"
href="https://pikwizard.com/photo/digitized-stock-market-data-shows-fluctuating-percentages-and-financial-graphs/221ba497326a31614b46c0ed50a55ccf/"
style="text-decoration: none; font-size: 10px; margin: 0;"
>
<img src="https://pikwizard.com/pw/medium/221ba497326a31614b46c0ed50a55ccf.jpg" style="margin: 0; width: 100%;" alt="" />
<p style="font-size: 12px; margin: 0;">PikWizard</p>
</a>
</span>
</span>
Free (free of charge)
Free for personal and commercial use.
Author: Creative Art
Similar Free Stock Images
Loading...

Premium


Premium


Premium


Premium


Premium


Premium


Premium


Premium

Premium


Premium

Premium

Premium


Premium


Premium


Premium


Premium


Premium


Premium

Premium


Premium


Premium

Premium


Premium


Premium

Premium