- Home >
- Stock Photos >
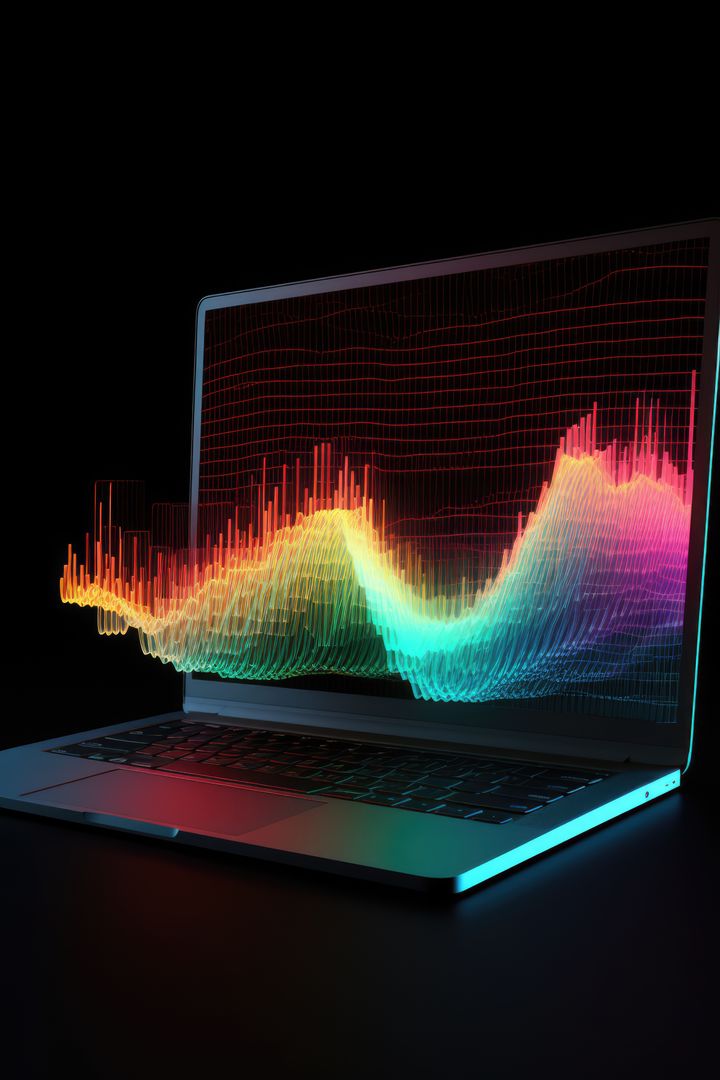
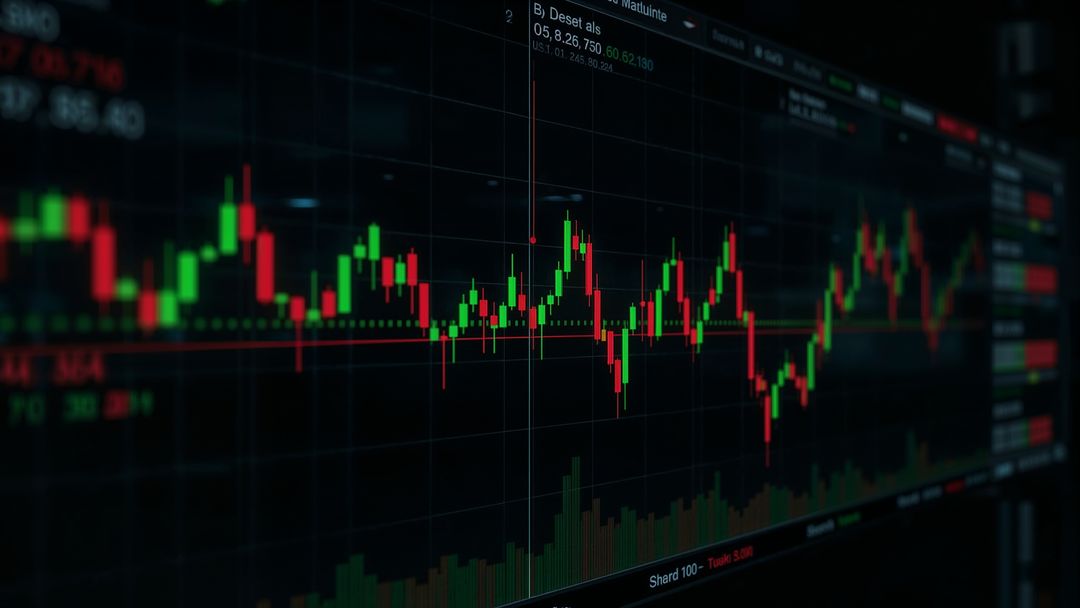
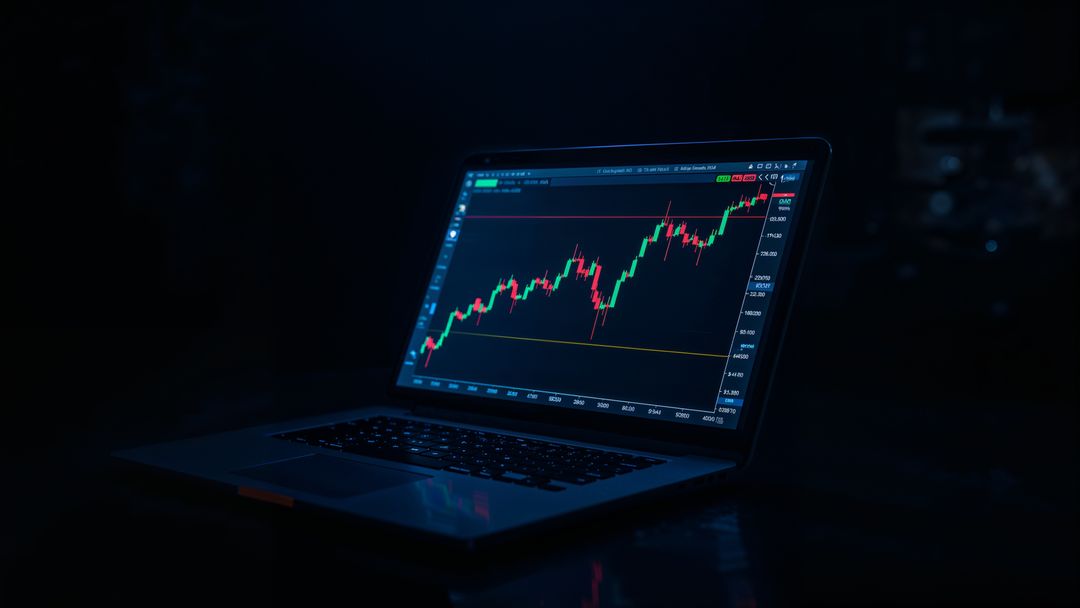
- Dimly lit laptop displaying candlestick chart for online trading analysis
Dimly lit laptop displaying candlestick chart for online trading analysis Image

AI Generated Image. A laptop sits in a dimly lit room with its screen showing a detailed candlestick chart, commonly used in financial trading and analysis. The sleek design of the laptop and the low light setting suggest a modern and professional environment. This image is ideal for representing finance, technology, trading analysis, market trends, or business strategies. Suitable for use in articles, presentations, websites related to stock trading, online trading, investment offices, or financial planning tools atmosphere projection.
Powered by 


0
downloads
downloads
Tags:
More
Credit Photo
If you would like to credit the Photo, here are some ways you can do so
Text Link
photo Link
<span class="text-link">
<span>
<a target="_blank" href=https://pikwizard.com/photo/dimly-lit-laptop-displaying-candlestick-chart-for-online-trading-analysis/51edbde80b9b82fc5b6d5beca3716a37/>PikWizard</a>
</span>
</span>
<span class="image-link">
<span
style="margin: 0 0 20px 0; display: inline-block; vertical-align: middle; width: 100%;"
>
<a
target="_blank"
href="https://pikwizard.com/photo/dimly-lit-laptop-displaying-candlestick-chart-for-online-trading-analysis/51edbde80b9b82fc5b6d5beca3716a37/"
style="text-decoration: none; font-size: 10px; margin: 0;"
>
<img src="https://pikwizard.com/pw/medium/51edbde80b9b82fc5b6d5beca3716a37.jpg" style="margin: 0; width: 100%;" alt="" />
<p style="font-size: 12px; margin: 0;">PikWizard</p>
</a>
</span>
</span>
Free (free of charge)
Free for personal and commercial use.
Author: AI Creator
Similar Free Stock Images