
- Home >
- Stock Photos >
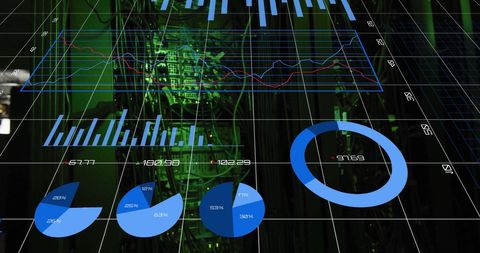
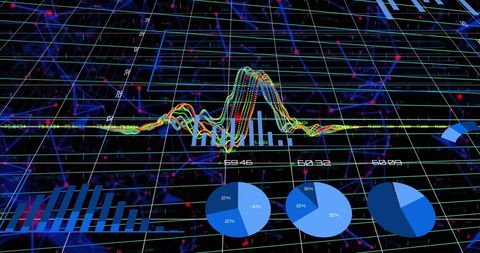
- Displaying 3D Data Visualization Dashboard with Blue Charts and Floating Green Binary Code
Displaying 3D Data Visualization Dashboard with Blue Charts and Floating Green Binary Code Image

Showing 3D grid plane populated with blue bar charts, pie charts, line graphs and floating green binary digits. Offering high-contrast, modern visual language for data-driven topics such as finance, tech, cybersecurity, AI and business intelligence. Working well for hero banners, presentations, whitepapers, website headers, blog posts and social media campaigns. Allowing overlay of text and logos while preserving readable chart elements. Supplying layered composition for motion graphics and video intros. Emphasizing neon green and electric blue palette on dark background to create futuristic, high-tech mood. Suitable for illustrating big data processing, real-time analytics, stock market tracking, dashboard design and machine learning insights. Including multiple chart types for visual storytelling and metric presentation.
Powered by  - Get 15% off with code: PIKWIZARD15


downloads
Tags:
More
Credit Photo
If you would like to credit the Photo, here are some ways you can do so
Text Link
photo Link
<span class="text-link">
<span>
<a target="_blank" href=https://pikwizard.com/photo/displaying-3d-data-visualization-dashboard-with-blue-charts-and-floating-green-binary-code/cbb35df413ca65d40d2aa50f3f464826/>PikWizard</a>
</span>
</span>
<span class="image-link">
<span
style="margin: 0 0 20px 0; display: inline-block; vertical-align: middle; width: 100%;"
>
<a
target="_blank"
href="https://pikwizard.com/photo/displaying-3d-data-visualization-dashboard-with-blue-charts-and-floating-green-binary-code/cbb35df413ca65d40d2aa50f3f464826/"
style="text-decoration: none; font-size: 10px; margin: 0;"
>
<img src="https://pikwizard.com/pw/medium/cbb35df413ca65d40d2aa50f3f464826.jpg" style="margin: 0; width: 100%;" alt="" />
<p style="font-size: 12px; margin: 0;">PikWizard</p>
</a>
</span>
</span>
Free (free of charge)
Free for personal and commercial use.
Author: People Creations
Similar Free Stock Images

Premium


Premium

Premium


Premium


AI


Premium


Premium


Premium


Premium


Premium


Premium


Premium


Premium


Premium

Premium


Premium


Premium


Premium


Premium


Premium


Premium


Premium


Premium


Premium


Premium

Premium

Explore More Free Stock Images