
- Home >
- Stock Photos >
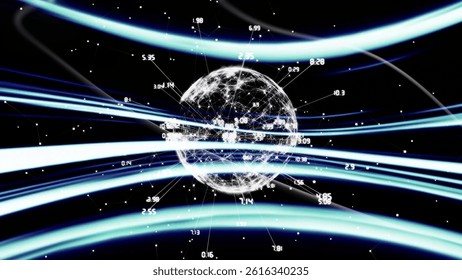
- Displaying 3D Wireframe Globe with Neon Line Graph and Streaming Code for Global Analytics
Displaying 3D Wireframe Globe with Neon Line Graph and Streaming Code for Global Analytics Image

Displaying wireframe 3D globe over illuminated grid, with jagged neon line graph tracking global market fluctuations. Featuring mesh sphere built from dotted lat-long points, overlaid streaming code and numeric data, evoking real-time analytics and network connectivity. Employing high-contrast teal-on-dark palette, creating futuristic tech mood suitable for fintech, cybersecurity, data science, and network operations. Ideal for website hero banners, fintech reports, investor presentations, news articles on markets or cyber threats, slide backgrounds for data analytics talks, and marketing materials for cloud or SaaS products. Offering wide panoramic composition for banners and headers; allowing easy color matching with brand accents and overlaying text or logos.
Powered by  - Get 15% off with code: PIKWIZARD15


downloads
Tags:
More
Credit Photo
If you would like to credit the Photo, here are some ways you can do so
Text Link
photo Link
<span class="text-link">
<span>
<a target="_blank" href=https://pikwizard.com/photo/displaying-3d-wireframe-globe-with-neon-line-graph-and-streaming-code-for-global-analytics/796232420f030c04ecd3431ec57b2ff4/>PikWizard</a>
</span>
</span>
<span class="image-link">
<span
style="margin: 0 0 20px 0; display: inline-block; vertical-align: middle; width: 100%;"
>
<a
target="_blank"
href="https://pikwizard.com/photo/displaying-3d-wireframe-globe-with-neon-line-graph-and-streaming-code-for-global-analytics/796232420f030c04ecd3431ec57b2ff4/"
style="text-decoration: none; font-size: 10px; margin: 0;"
>
<img src="https://pikwizard.com/pw/medium/796232420f030c04ecd3431ec57b2ff4.jpg" style="margin: 0; width: 100%;" alt="" />
<p style="font-size: 12px; margin: 0;">PikWizard</p>
</a>
</span>
</span>
Free (free of charge)
Free for personal and commercial use.
Author: Creative Art
Similar Free Stock Images

Premium


Premium

Premium


Premium


Premium


Premium


Premium


Premium

Premium


Premium

Premium


Premium

Premium

Premium


Premium


Premium


Premium


Premium


Premium


Premium

Premium


AI


Premium


Premium

Premium


Premium


Explore More Free Stock Images