
- Home >
- Free Stock Photos & Images >
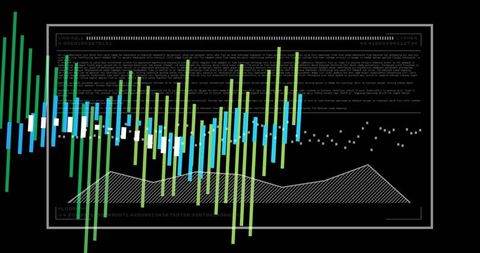
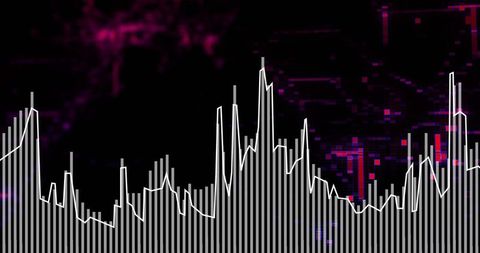
- Displaying abstract digital waveform with colorful vertical bars, code panel and numeric data overla
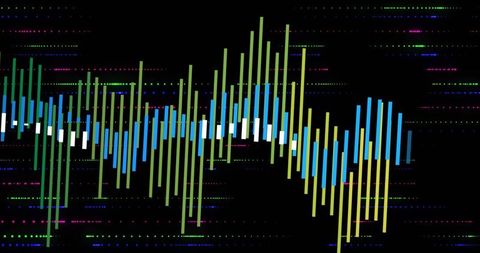
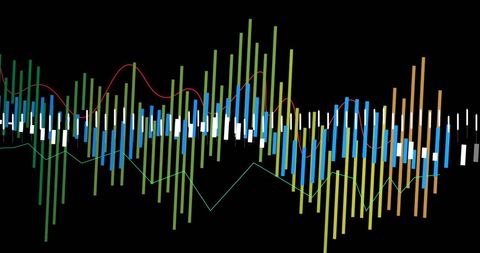
Displaying abstract digital waveform with colorful vertical bars, code panel and numeric data overla Free Stock Image
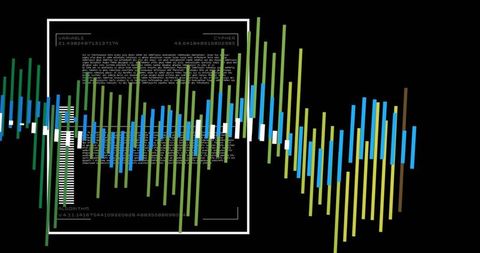
Abstract tech composition showing colorful vertical bars forming waveform across black background with code panel, numeric tags and algorithm notation. Clean minimalist layout combining analytics aesthetics with audio spectrum visuals and subtle cypher text. Palette using blue, green and yellow bars for high-contrast modern look. Suiting website hero banners, app dashboards, presentation slides, marketing campaigns, album covers, music streaming visuals, cybersecurity or fintech reports, UX/UI concept mockups and tech event posters. Pairing well with bold typography, transparent overlays and animated transitions for video intros or interactive dashboards. Useful for editorial illustrations about data science, signal processing, audio engineering, machine learning, encryption and algorithmic art.
Powered by  - Get 15% off with code: PIKWIZARD15


downloads
Tags:
More
Credit Photo
If you would like to credit the Photo, here are some ways you can do so
Text Link
photo Link
<span class="text-link">
<span>
<a target="_blank" href=https://pikwizard.com/photo/displaying-abstract-digital-waveform-with-colorful-vertical-bars-code-panel-and-numeric-data-overla/a258c736b3a44bdb2363ffc97ecf7467/>PikWizard</a>
</span>
</span>
<span class="image-link">
<span
style="margin: 0 0 20px 0; display: inline-block; vertical-align: middle; width: 100%;"
>
<a
target="_blank"
href="https://pikwizard.com/photo/displaying-abstract-digital-waveform-with-colorful-vertical-bars-code-panel-and-numeric-data-overla/a258c736b3a44bdb2363ffc97ecf7467/"
style="text-decoration: none; font-size: 10px; margin: 0;"
>
<img src="https://thumbs.wbm.im/pw/medium/a258c736b3a44bdb2363ffc97ecf7467.jpg" style="margin: 0; width: 100%;" alt="Displaying abstract digital waveform with colorful vertical bars, code panel and numeric data overla" />
<p style="font-size: 12px; margin: 0;">PikWizard</p>
</a>
</span>
</span>
Free (free of charge)
Free for personal and commercial use.
Author: Creative Art
Similar Free Stock Images


Premium


Premium


Premium


Premium


Premium


Premium


Premium


Premium


Premium


Premium


Premium


Premium


Premium


Premium


Premium


Premium


Premium


Premium


Premium


Premium


Premium


Premium


Premium


Premium


Premium

Explore More Free Stock Images