- Home >
- Stock Photos >
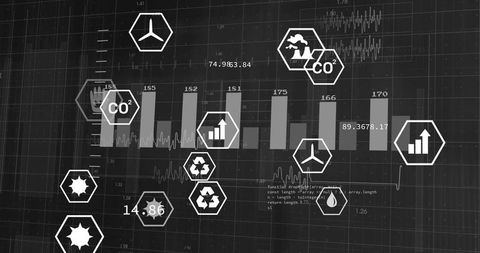
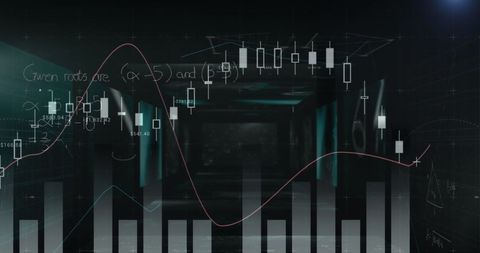
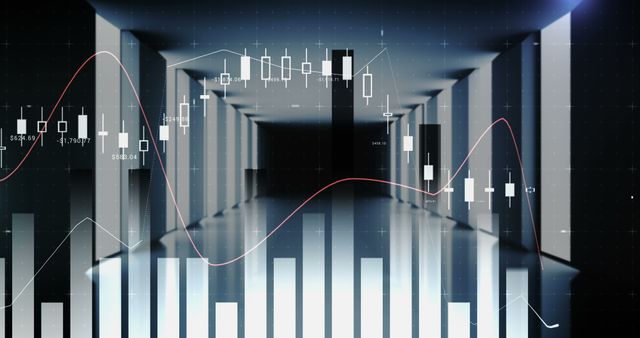
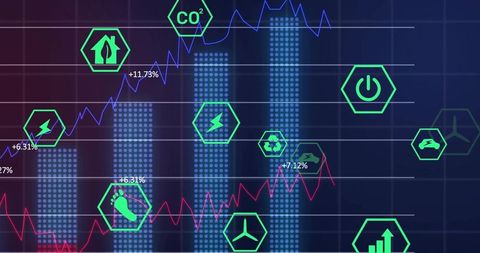
- Displaying analytics dashboard overlaying modern corridor with energy, finance, green icons
Displaying analytics dashboard overlaying modern corridor with energy, finance, green icons Image

Overlaying translucent analytics dashboard on modern corridor interior, showing candlestick, bar and line charts with hex icons representing energy, sustainability and finance. Featuring neon green iconography and pink trend line for clear data emphasis and visual contrast. Composition leaving central dark corridor area for headline or logo placement. Ideal for website hero banners, corporate presentations, fintech landing pages, energy sector reports, sustainability campaigns, investor pitch decks, annual reports, technology blogs and social media marketing. Designers cropping for banner and hero formats, adding headline text over negative space, animating charts for video or interactive UI prototypes, and using as background for data-driven storytelling.
Powered by  - Get 15% off with code: PIKWIZARD15


downloads
Tags:
More
Credit Photo
If you would like to credit the Photo, here are some ways you can do so
Text Link
photo Link
<span class="text-link">
<span>
<a target="_blank" href=https://pikwizard.com/photo/displaying-analytics-dashboard-overlaying-modern-corridor-with-energy-finance-green-icons/a1c94c41815b077b22ad560f90178e16/>PikWizard</a>
</span>
</span>
<span class="image-link">
<span
style="margin: 0 0 20px 0; display: inline-block; vertical-align: middle; width: 100%;"
>
<a
target="_blank"
href="https://pikwizard.com/photo/displaying-analytics-dashboard-overlaying-modern-corridor-with-energy-finance-green-icons/a1c94c41815b077b22ad560f90178e16/"
style="text-decoration: none; font-size: 10px; margin: 0;"
>
<img src="https://pikwizard.com/pw/medium/a1c94c41815b077b22ad560f90178e16.jpg" style="margin: 0; width: 100%;" alt="" />
<p style="font-size: 12px; margin: 0;">PikWizard</p>
</a>
</span>
</span>
Free (free of charge)
Free for personal and commercial use.
Author: Awesome Content
Similar Free Stock Images
Loading...

Premium


Premium


Premium

Premium

Premium


Premium


Premium


Premium


Premium


Premium

Premium


Premium


Premium


Premium


Premium

Premium


Premium


Premium


Premium


Premium


Premium

Premium


Premium


Premium


Premium