- Home >
- Stock Photos >
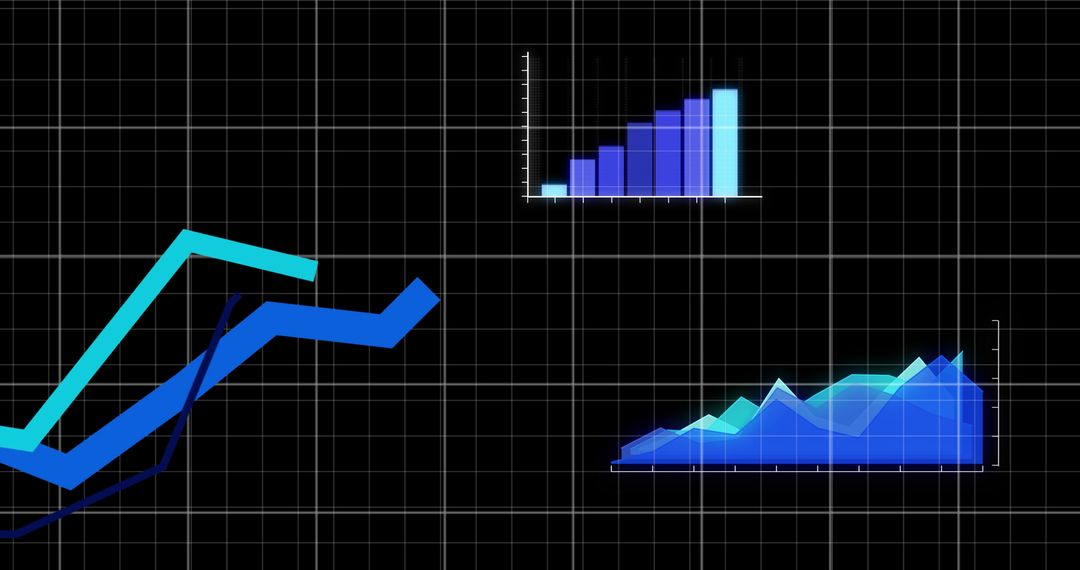
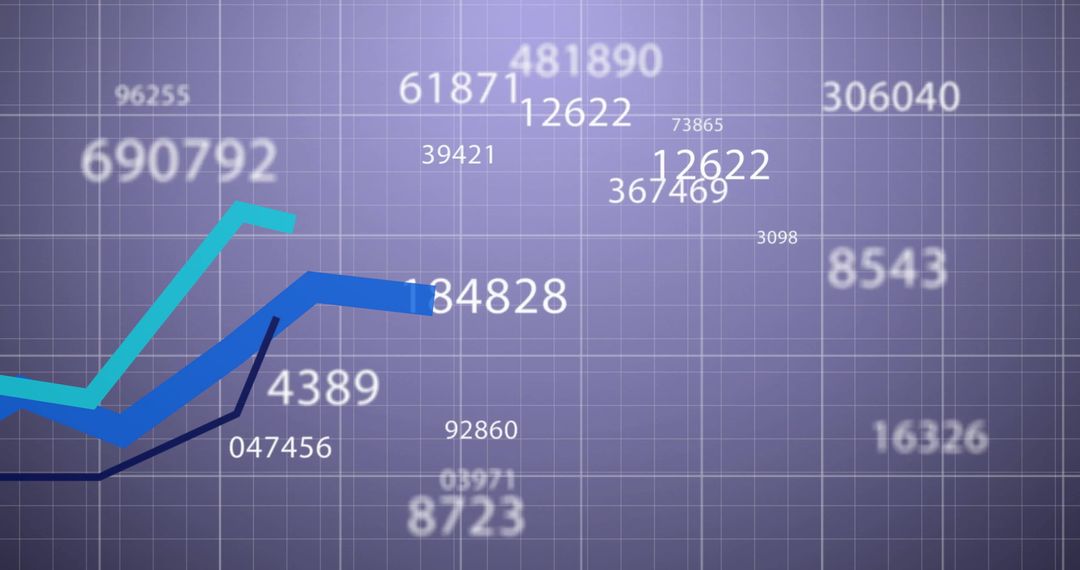
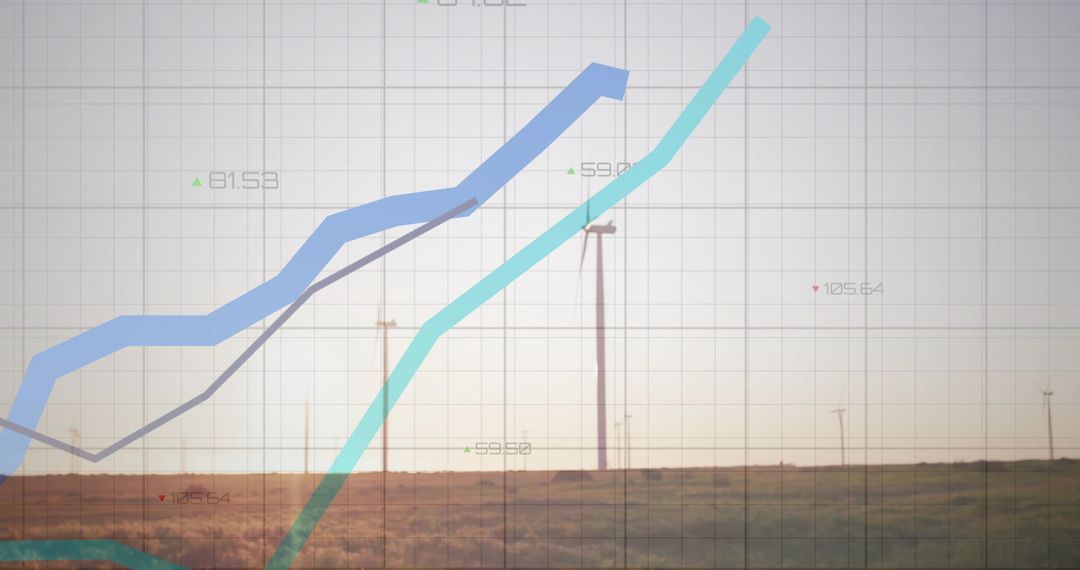
- Displaying Blue Trend Lines on Grid Analytics Dashboard with Markers and Data Values
Displaying Blue Trend Lines on Grid Analytics Dashboard with Markers and Data Values Image

Featuring central gray grid with vertical and horizontal ticks, three bold blue trend lines plus thin dark polyline annotated with triangular markers and numeric labels. Foreground lines showing upward and downward movements, creating clear contrast against muted background. Working well for finance, business analytics, market research, data reporting, presentation slides. Design suiting hero headers, slide decks, social posts, blog illustrations, annual reports, pitch decks, infographics, UI mockups. Color palette and minimalist grid allowing easy overlay of logos, headlines, callouts. File adaptable for print and web, useful for illustrating trends, performance metrics, comparative data series, forecasting, technical analysis, KPI dashboards, investor communications.
Powered by  - Get 15% off with code: PIKWIZARD15


0
downloads
downloads
Tags:
More
Credit Photo
If you would like to credit the Photo, here are some ways you can do so
Text Link
photo Link
<span class="text-link">
<span>
<a target="_blank" href=https://pikwizard.com/photo/displaying-blue-trend-lines-on-grid-analytics-dashboard-with-markers-and-data-values/df90bf549a5ca4ff1d5dc4046a50fa71/>PikWizard</a>
</span>
</span>
<span class="image-link">
<span
style="margin: 0 0 20px 0; display: inline-block; vertical-align: middle; width: 100%;"
>
<a
target="_blank"
href="https://pikwizard.com/photo/displaying-blue-trend-lines-on-grid-analytics-dashboard-with-markers-and-data-values/df90bf549a5ca4ff1d5dc4046a50fa71/"
style="text-decoration: none; font-size: 10px; margin: 0;"
>
<img src="https://pikwizard.com/pw/medium/df90bf549a5ca4ff1d5dc4046a50fa71.jpg" style="margin: 0; width: 100%;" alt="" />
<p style="font-size: 12px; margin: 0;">PikWizard</p>
</a>
</span>
</span>
Free (free of charge)
Free for personal and commercial use.
Author: People Creations
Similar Free Stock Images

Premium


Premium


Premium


Premium


Premium


Premium


Premium


Premium


Premium


Premium


Premium


Premium


Premium


Premium


Premium


Premium


Premium


Premium


Premium


Premium


Premium


Premium


Premium


Premium