- Home >
- Stock Photos >
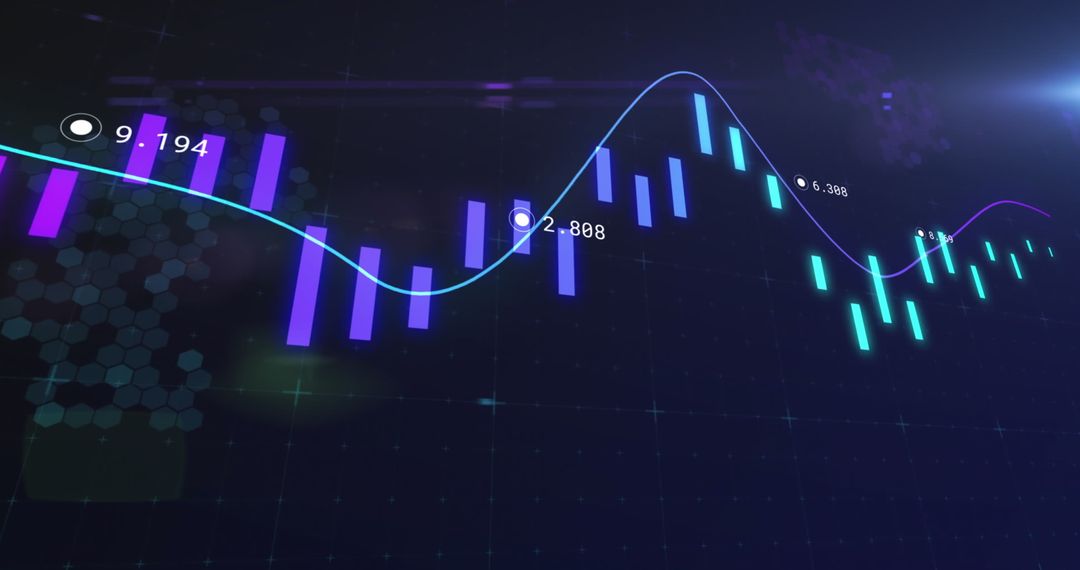
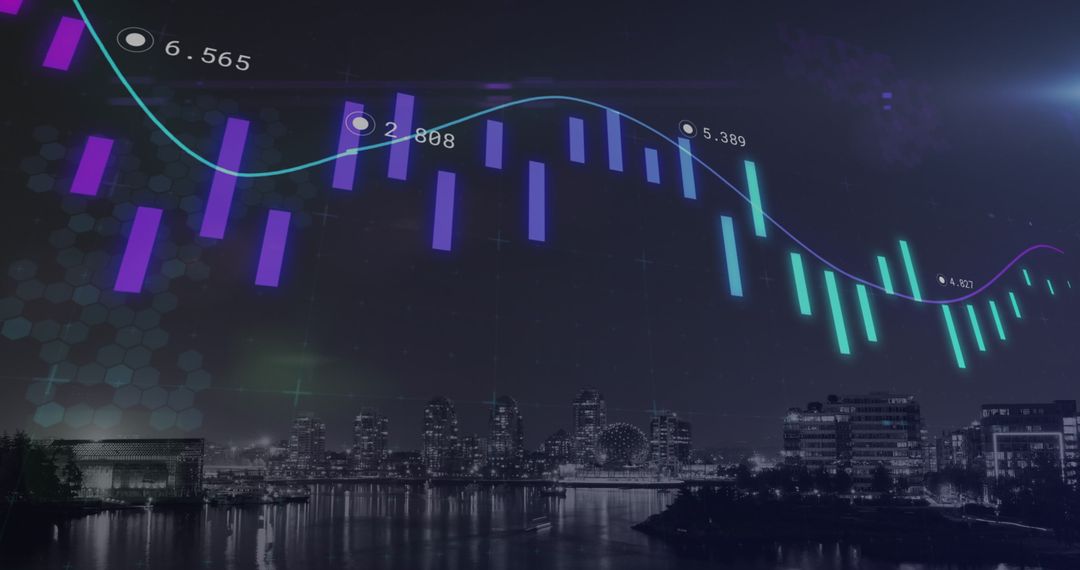
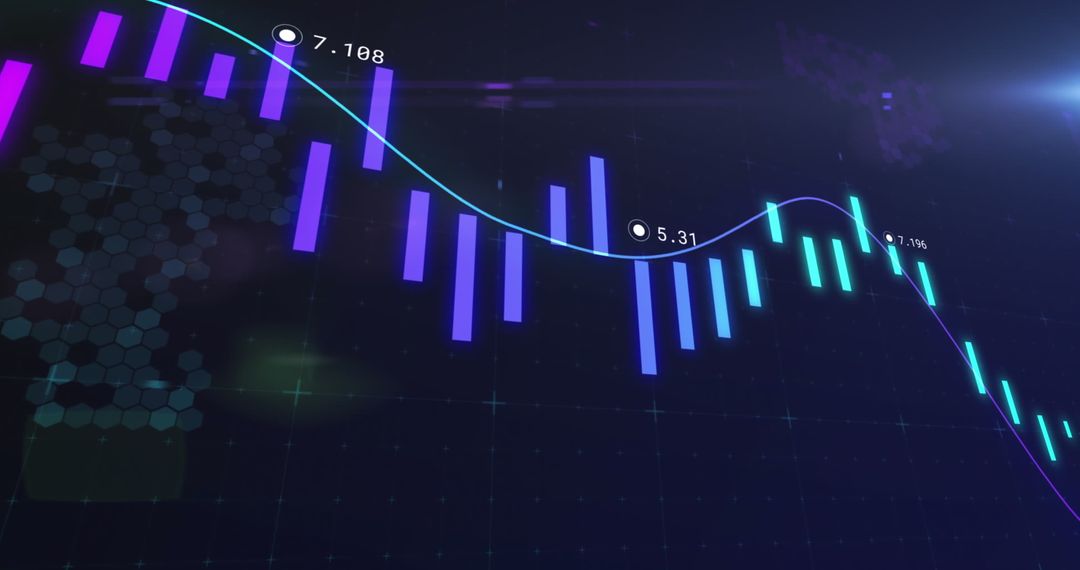
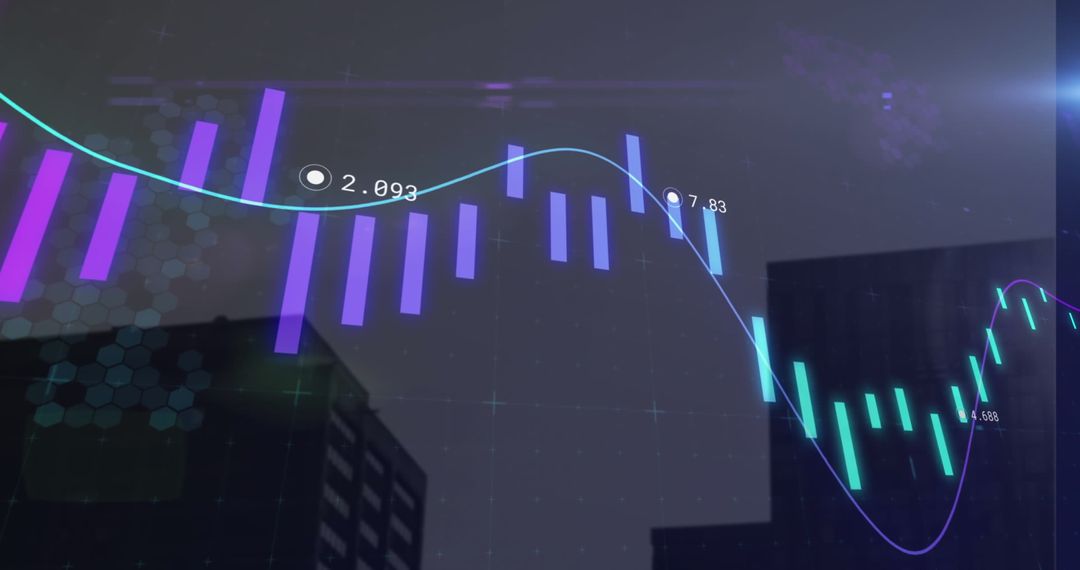
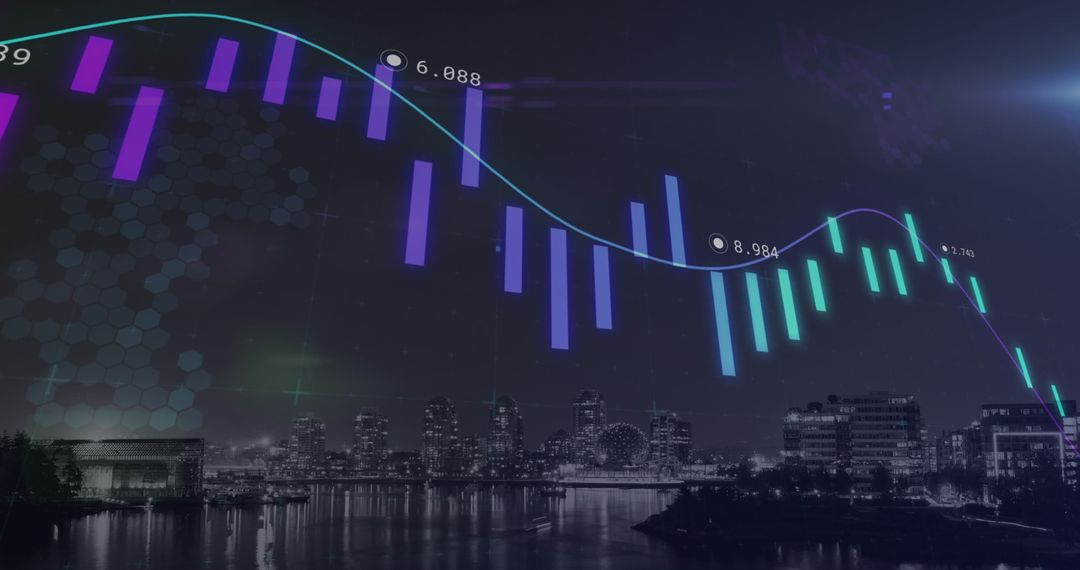
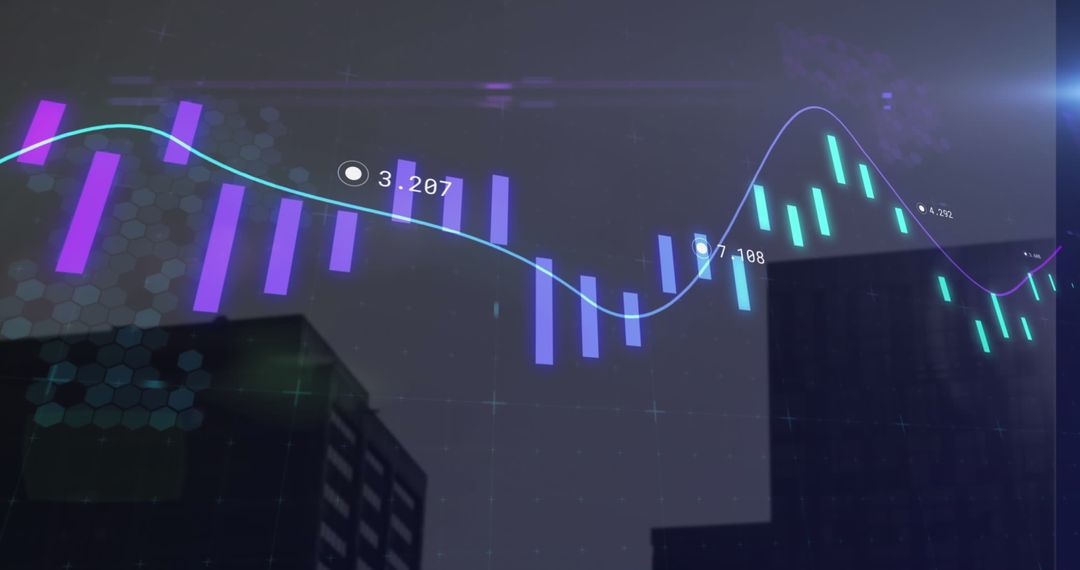
- Displaying candlestick chart with magenta trend line and circular markers on purple gradient
Displaying candlestick chart with magenta trend line and circular markers on purple gradient Image

Abstract financial dashboard composition showing candlestick chart with magenta trend line, white circular markers and vertical bars over purple gradient background. Clean minimal layout allowing overlaying text, logos and numeric labels. Serving fintech presentations, investor reports, market analysis slides, trading platform UI, blog headers, social media posts and marketing collateral. Helping explain market trends, comparing price movements, demonstrating technical analysis indicators and teaching trading strategies. High contrast magenta line guiding viewer focus while circular markers highlighting key data points. Ample negative space reserved for headline, call-to-action or data overlays. Compatible with light or dark UI themes, easily recoloring elements to match brand palette.
Powered by 


0
downloads
downloads
Tags:
More
Credit Photo
If you would like to credit the Photo, here are some ways you can do so
Text Link
photo Link
<span class="text-link">
<span>
<a target="_blank" href=https://pikwizard.com/photo/displaying-candlestick-chart-with-magenta-trend-line-and-circular-markers-on-purple-gradient/029df2777ad68d460f43f3def5976b0b/>PikWizard</a>
</span>
</span>
<span class="image-link">
<span
style="margin: 0 0 20px 0; display: inline-block; vertical-align: middle; width: 100%;"
>
<a
target="_blank"
href="https://pikwizard.com/photo/displaying-candlestick-chart-with-magenta-trend-line-and-circular-markers-on-purple-gradient/029df2777ad68d460f43f3def5976b0b/"
style="text-decoration: none; font-size: 10px; margin: 0;"
>
<img src="https://pikwizard.com/pw/medium/029df2777ad68d460f43f3def5976b0b.jpg" style="margin: 0; width: 100%;" alt="" />
<p style="font-size: 12px; margin: 0;">PikWizard</p>
</a>
</span>
</span>
Free (free of charge)
Free for personal and commercial use.
Author: People Creations
Similar Free Stock Images

Premium


Premium


Premium


Premium


Premium


Premium


Premium


Premium


Premium


Premium


Premium


Premium


Premium


Premium


Premium


Premium


Premium


Premium


Premium


Premium


Premium


Premium


Premium


Premium