- Home >
- Stock Photos >
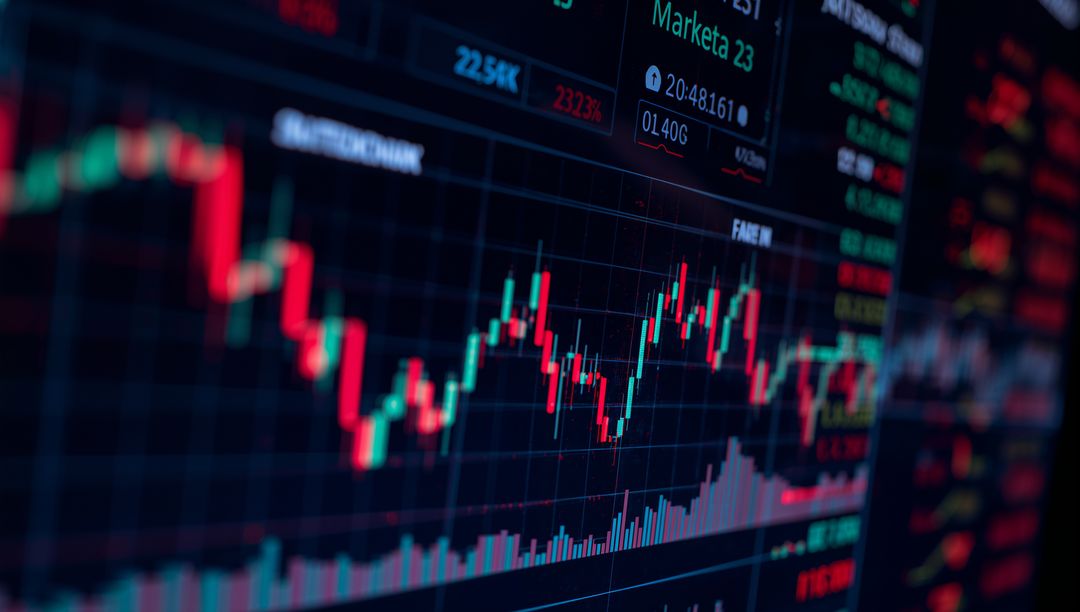
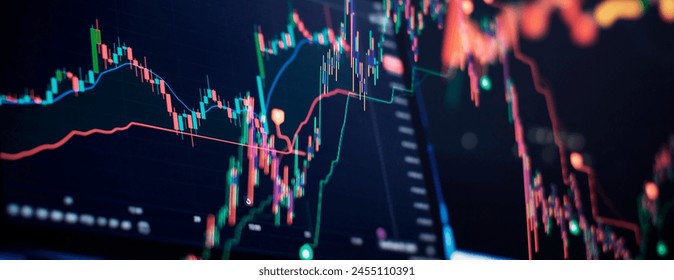
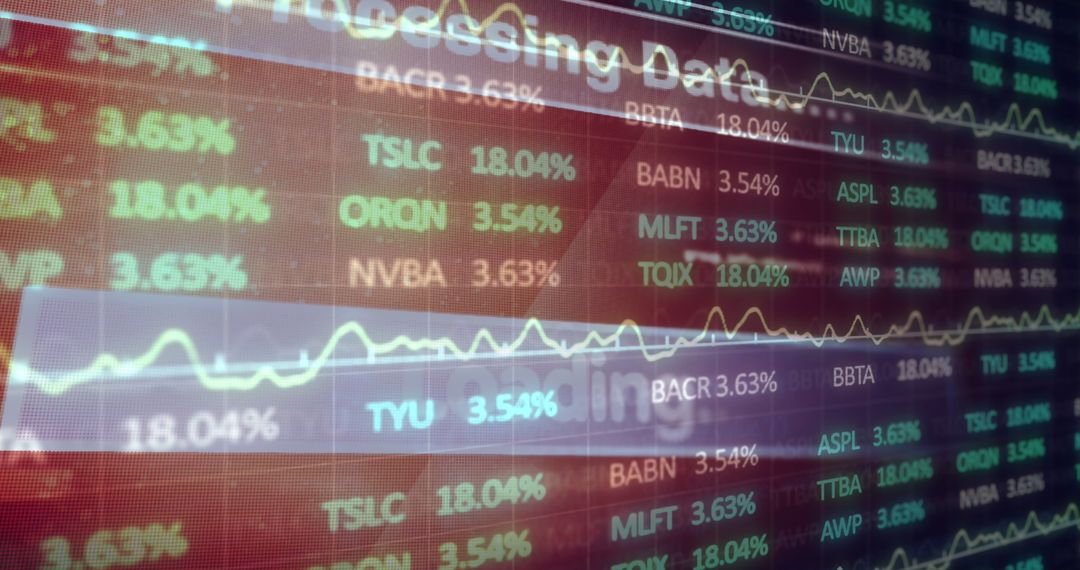
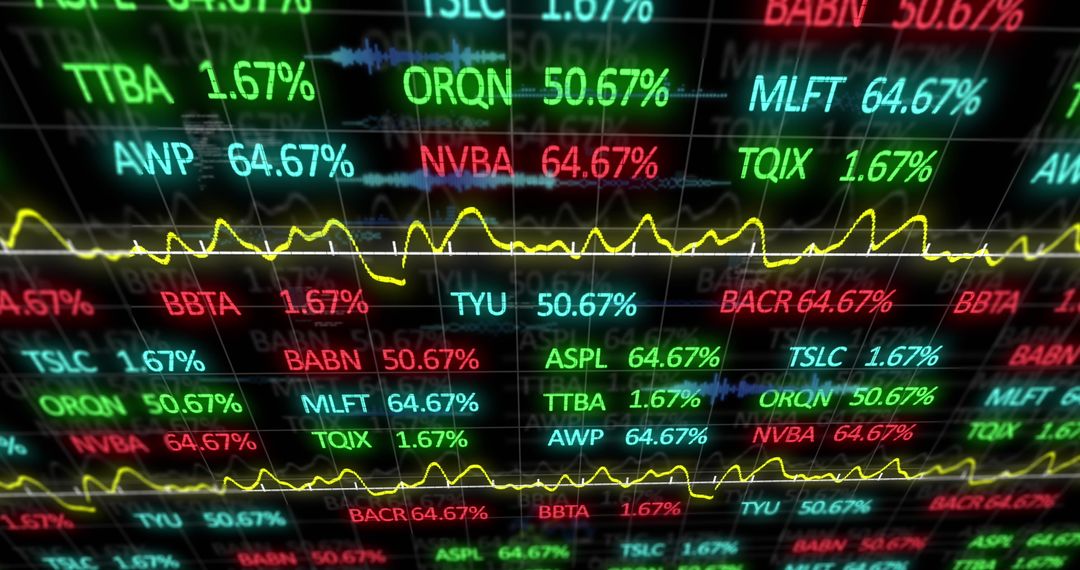
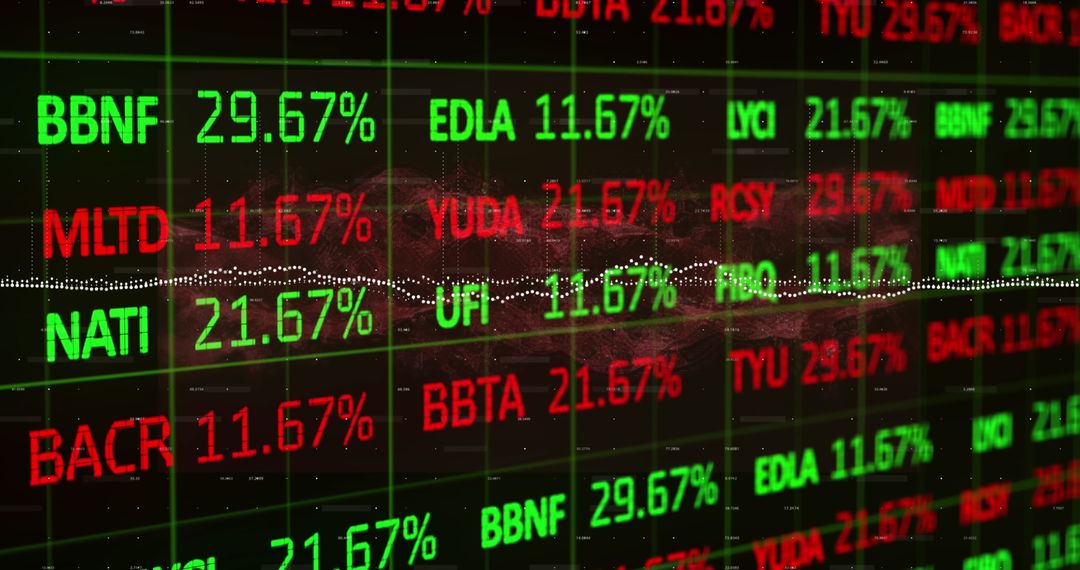
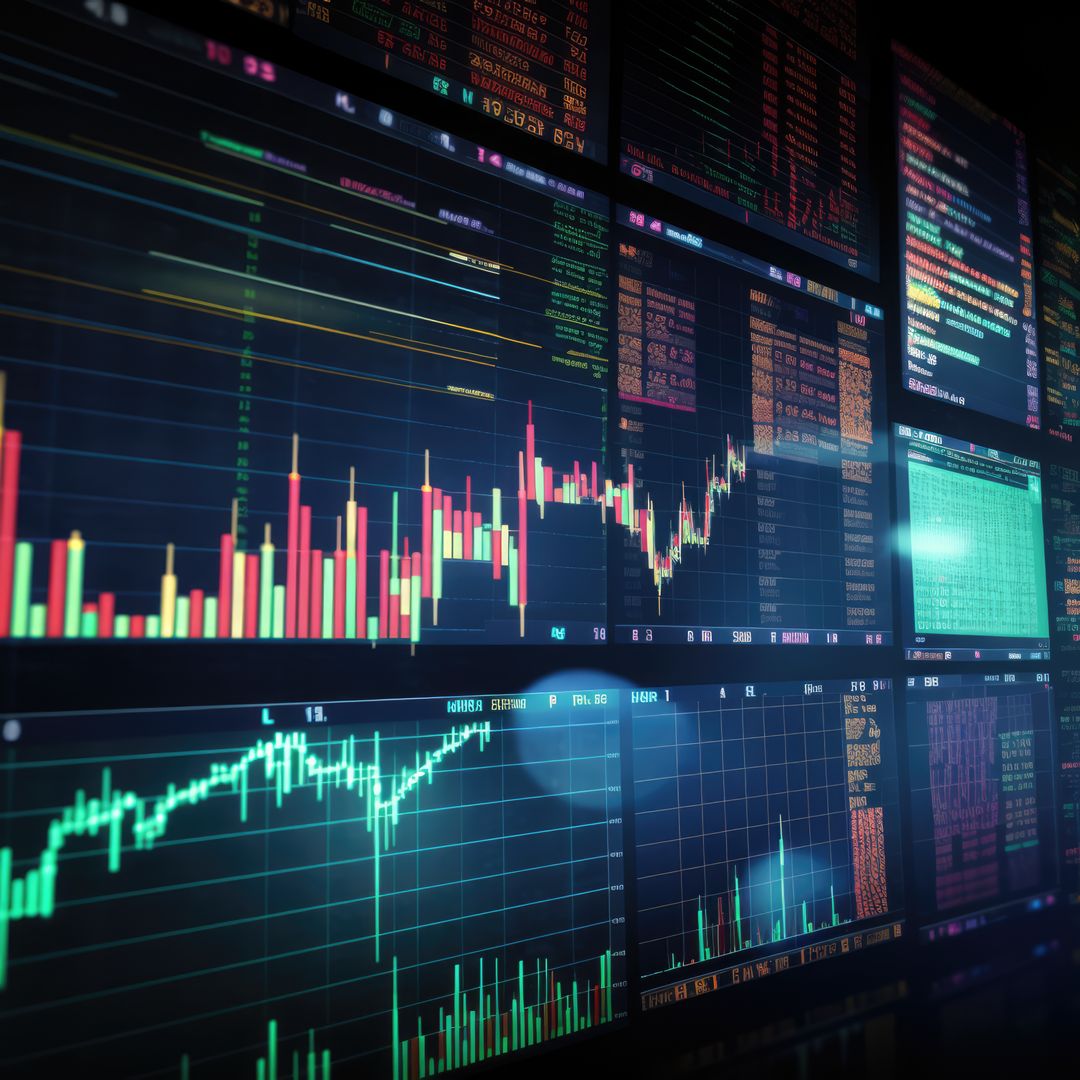
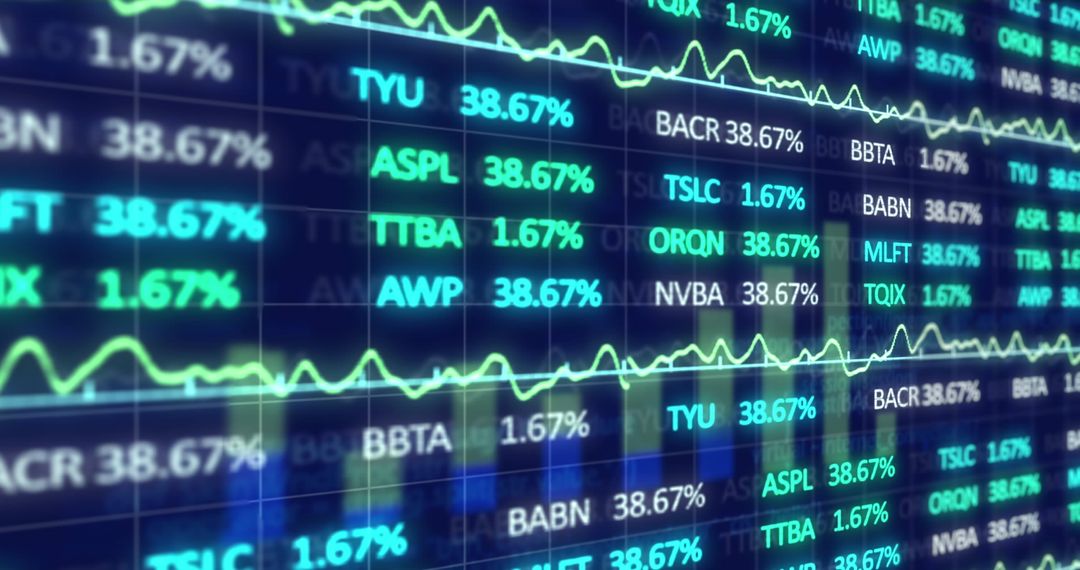
- Displaying Candlestick Chart with Moving Averages Showing Market Volatility and Volume
Displaying Candlestick Chart with Moving Averages Showing Market Volatility and Volume Image

AI Generated Image. Showing close-up candlestick chart with red and green bars, moving averages, volume histogram and numerical tick data. Conveying market volatility, price momentum and active trading activity for fintech, brokerage and investment audiences. Supporting uses: hero banner for finance websites, background for trading platform dashboards, blog illustration for market analysis, slide graphic for investor presentations, social media asset for trading education, advertisement creative for brokerage services. Providing ample negative space on right side for overlaying text, logos or data callouts. Featuring dark color palette with neon red and green accents for high-contrast modern look. Delivering versatile crop options for widescreen headers, social squares and vertical stories. Noting AI-generated origin for conceptual or editorial projects.
Powered by  - Get 15% off with code: PIKWIZARD15


0
downloads
downloads
Tags:
More
Credit Photo
If you would like to credit the Photo, here are some ways you can do so
Text Link
photo Link
<span class="text-link">
<span>
<a target="_blank" href=https://pikwizard.com/photo/displaying-candlestick-chart-with-moving-averages-showing-market-volatility-and-volume/905fa1b06f65ecb80c31601f02d09a84/>PikWizard</a>
</span>
</span>
<span class="image-link">
<span
style="margin: 0 0 20px 0; display: inline-block; vertical-align: middle; width: 100%;"
>
<a
target="_blank"
href="https://pikwizard.com/photo/displaying-candlestick-chart-with-moving-averages-showing-market-volatility-and-volume/905fa1b06f65ecb80c31601f02d09a84/"
style="text-decoration: none; font-size: 10px; margin: 0;"
>
<img src="https://pikwizard.com/pw/medium/905fa1b06f65ecb80c31601f02d09a84.jpg" style="margin: 0; width: 100%;" alt="" />
<p style="font-size: 12px; margin: 0;">PikWizard</p>
</a>
</span>
</span>
Free (free of charge)
Free for personal and commercial use.
Author: AI Creator
Similar Free Stock Images

Premium


Premium


Premium


Premium


Premium


Premium


Premium


Premium


Premium


Premium


Premium


Premium


Premium


Premium


Premium


Premium


Premium


Premium


Premium


Premium


Premium


Premium


Premium


Premium