- Home >
- Stock Photos >
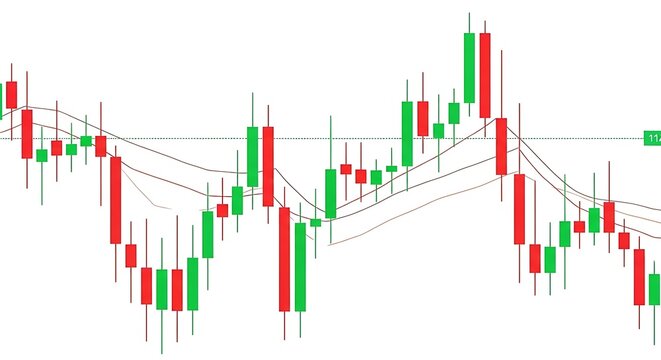
- Displaying Candlestick Chart with Trend Lines, Analytics Bubbles and Market Data Overlay
Displaying Candlestick Chart with Trend Lines, Analytics Bubbles and Market Data Overlay Image

Close-up view showing blue candlestick bars, multiple colored trend lines, grid background and floating data bubbles displaying percentages, counters and icons. Design conveying market volatility, price movement and technical indicators for trader and analyst audiences. Suiting financial websites, trading platforms, fintech apps, investor presentations, market reports, blog posts and social media. Working well as hero banner, slide background, thumbnail or editorial illustration. Leaving room for headline or overlay text on right side and allowing easy cropping for square or vertical formats. Considering color tinting and opacity adjustments to match brand palette and improve legibility. Providing high-impact visual for articles about market analysis, investing strategy, trading tools, fintech innovation and data-driven finance.
Powered by 


0
downloads
downloads
Tags:
More
Credit Photo
If you would like to credit the Photo, here are some ways you can do so
Text Link
photo Link
<span class="text-link">
<span>
<a target="_blank" href=https://pikwizard.com/photo/displaying-candlestick-chart-with-trend-lines-analytics-bubbles-and-market-data-overlay/a21bc705deeda0c7ff502df6986b528e/>PikWizard</a>
</span>
</span>
<span class="image-link">
<span
style="margin: 0 0 20px 0; display: inline-block; vertical-align: middle; width: 100%;"
>
<a
target="_blank"
href="https://pikwizard.com/photo/displaying-candlestick-chart-with-trend-lines-analytics-bubbles-and-market-data-overlay/a21bc705deeda0c7ff502df6986b528e/"
style="text-decoration: none; font-size: 10px; margin: 0;"
>
<img src="https://pikwizard.com/pw/medium/a21bc705deeda0c7ff502df6986b528e.jpg" style="margin: 0; width: 100%;" alt="" />
<p style="font-size: 12px; margin: 0;">PikWizard</p>
</a>
</span>
</span>
Free (free of charge)
Free for personal and commercial use.
Author: Creative Art
Similar Free Stock Images

Premium


Premium


Premium


Premium


Premium


Premium


Premium


Premium


Premium


Premium


Premium


Premium


Premium


Premium


Premium


Premium


Premium


Premium


Premium


Premium


Premium


Premium


Premium


Premium