- Home >
- Stock Photos >
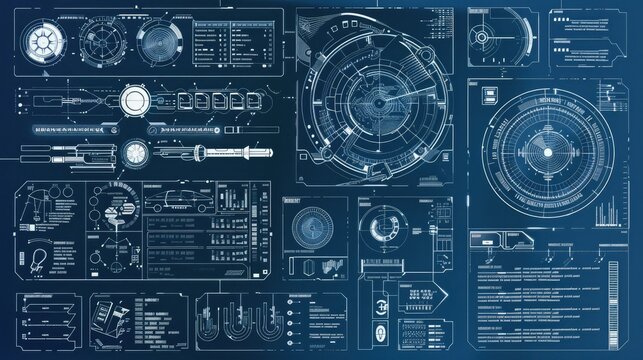
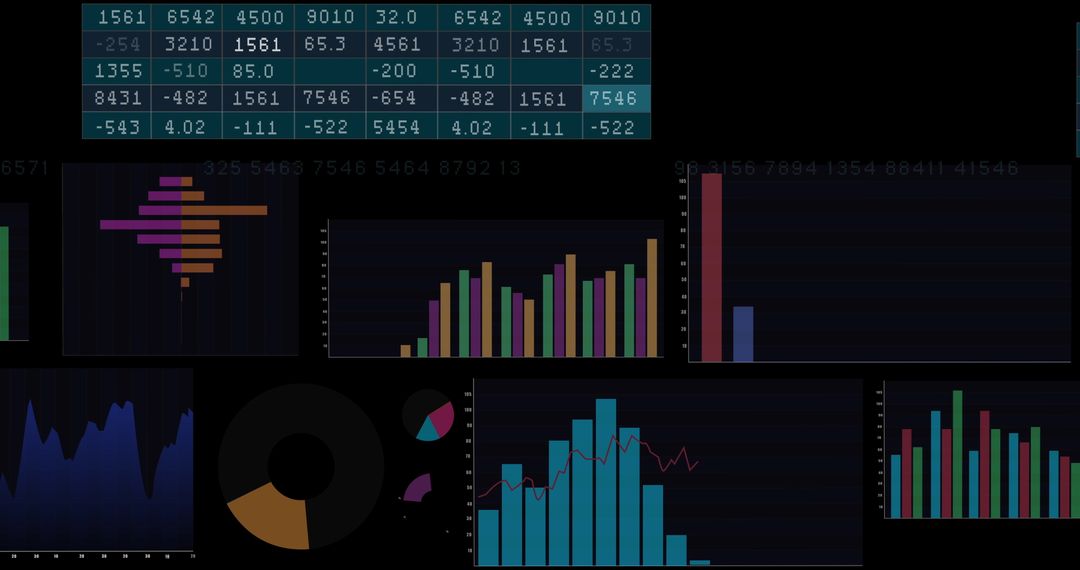
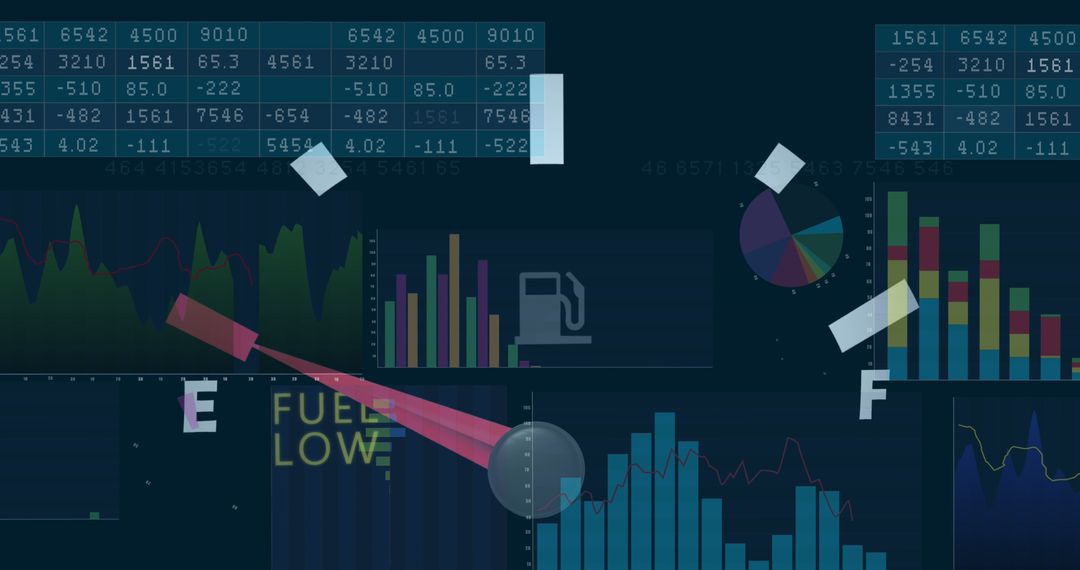
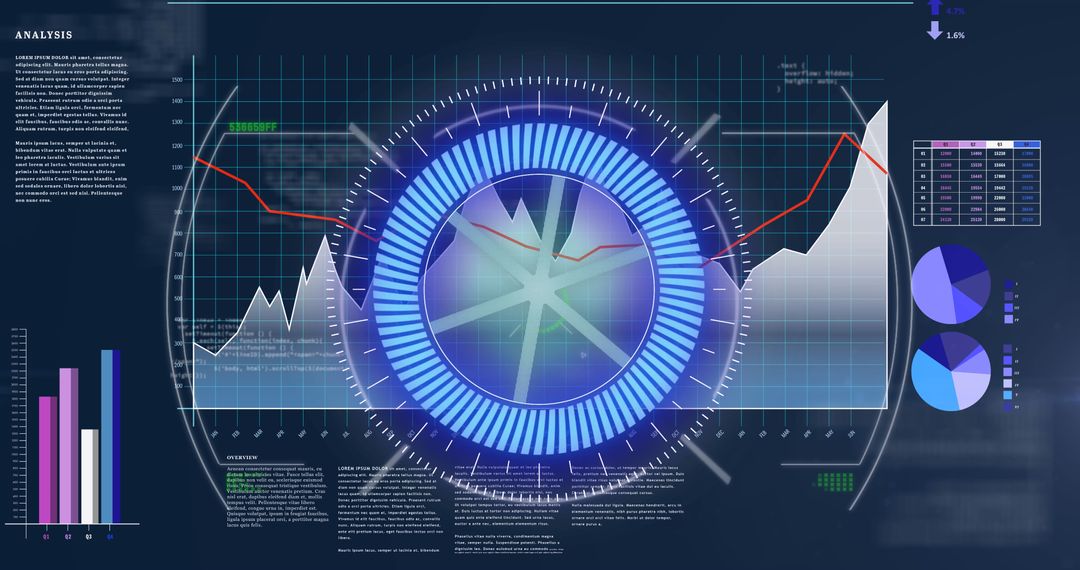
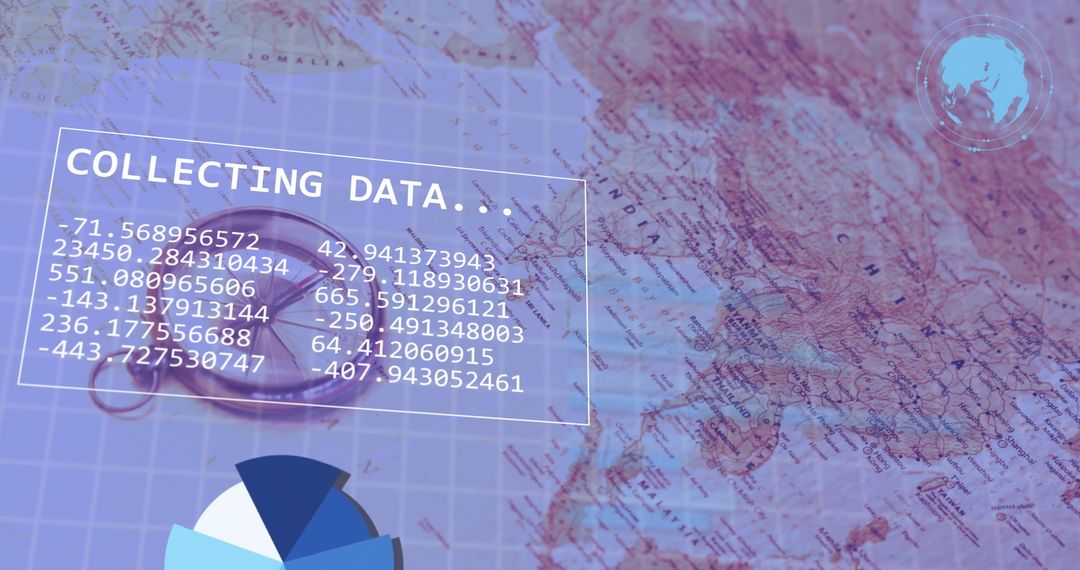
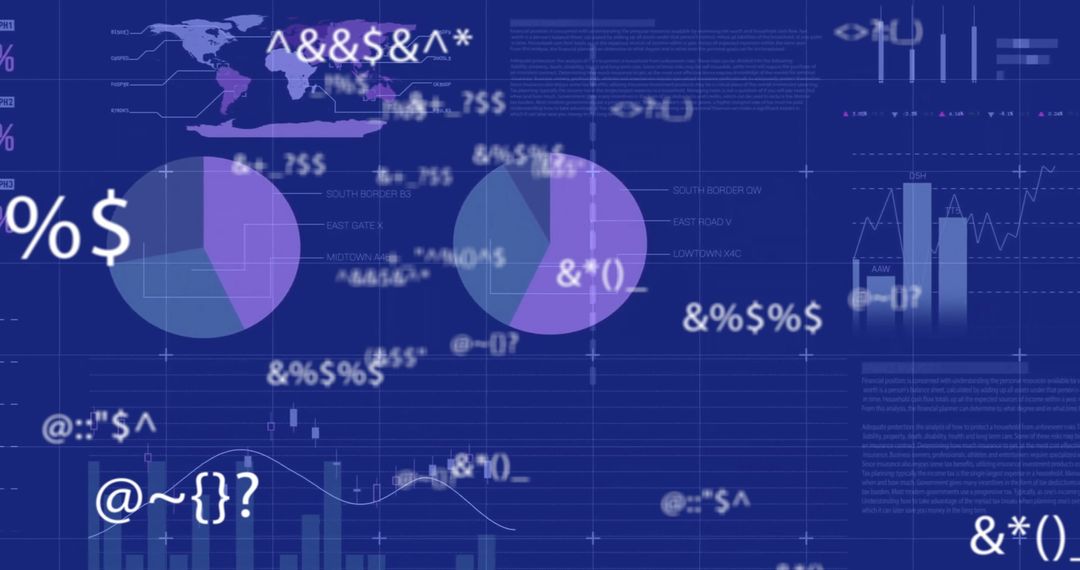
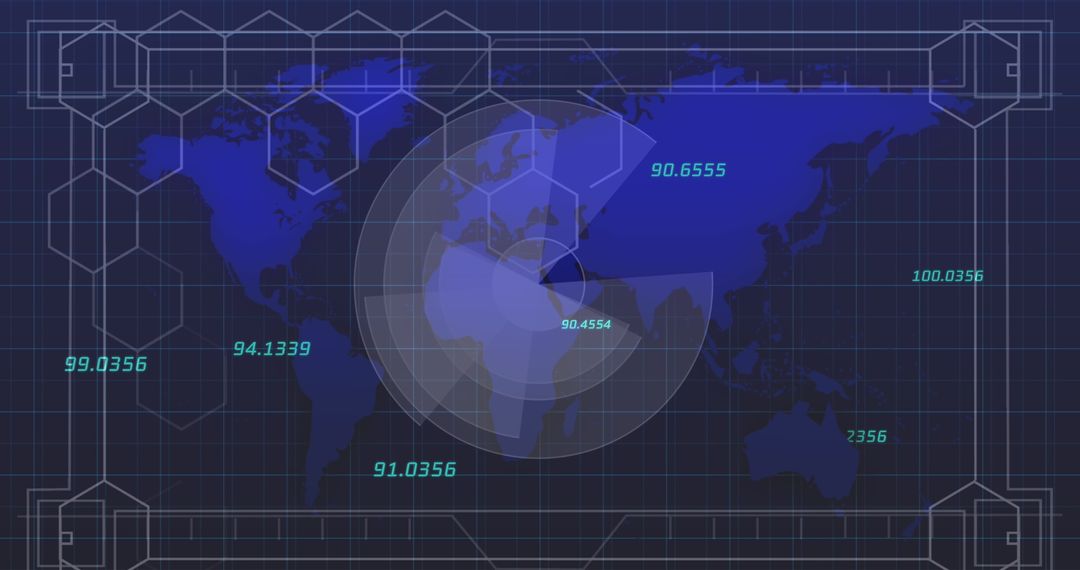
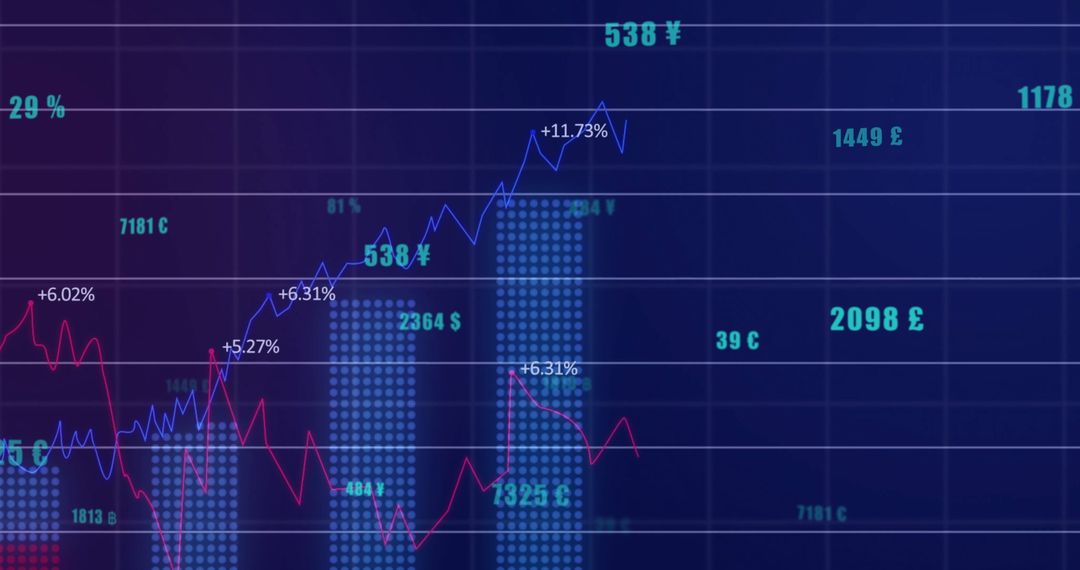
- Displaying concentric HUD numeric readouts on neon analytics dashboard for financial data
Displaying concentric HUD numeric readouts on neon analytics dashboard for financial data Image

Featuring concentric circular HUD overlays with prominent numeric readouts layered over multi-chart analytics panels. Showing colorful bar charts, line graphs, and segmented pie charts with neon highlights and subtle grid texture. Creating futuristic tech vibe suitable for fintech, business intelligence, data science, and dashboard UI design. Serving as strong hero graphic for website headers, presentation slides, investor reports, app backgrounds, marketing materials, and video overlays. Allowing easy cropping for banner sizes and adding text overlays for headlines or key metrics.
Powered by 


0
downloads
downloads
Tags:
More
Credit Photo
If you would like to credit the Photo, here are some ways you can do so
Text Link
photo Link
<span class="text-link">
<span>
<a target="_blank" href=https://pikwizard.com/photo/displaying-concentric-hud-numeric-readouts-on-neon-analytics-dashboard-for-financial-data/167a92efc99ce4b94c8987984ddb6a7e/>PikWizard</a>
</span>
</span>
<span class="image-link">
<span
style="margin: 0 0 20px 0; display: inline-block; vertical-align: middle; width: 100%;"
>
<a
target="_blank"
href="https://pikwizard.com/photo/displaying-concentric-hud-numeric-readouts-on-neon-analytics-dashboard-for-financial-data/167a92efc99ce4b94c8987984ddb6a7e/"
style="text-decoration: none; font-size: 10px; margin: 0;"
>
<img src="https://pikwizard.com/pw/medium/167a92efc99ce4b94c8987984ddb6a7e.jpg" style="margin: 0; width: 100%;" alt="" />
<p style="font-size: 12px; margin: 0;">PikWizard</p>
</a>
</span>
</span>
Free (free of charge)
Free for personal and commercial use.
Author: Awesome Content
Similar Free Stock Images
Premium


Premium


Premium


Premium


Premium


Premium


Premium


Premium


Premium


Premium


Premium


Premium


Premium


Premium


Premium


Premium


Premium


Premium


Premium


Premium


Premium


Premium


Premium


Premium