
- Home >
- Stock Photos >
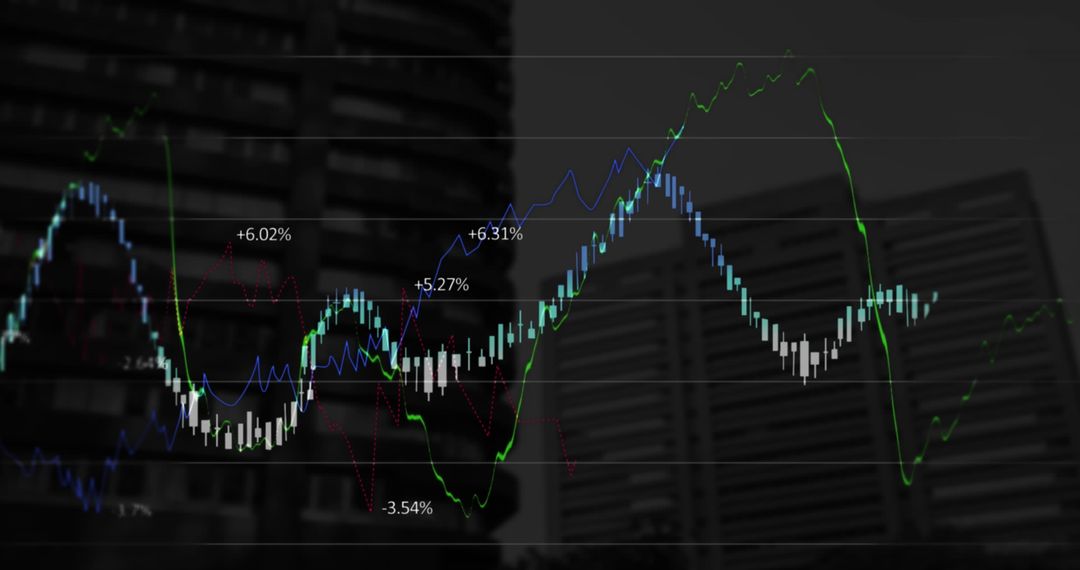
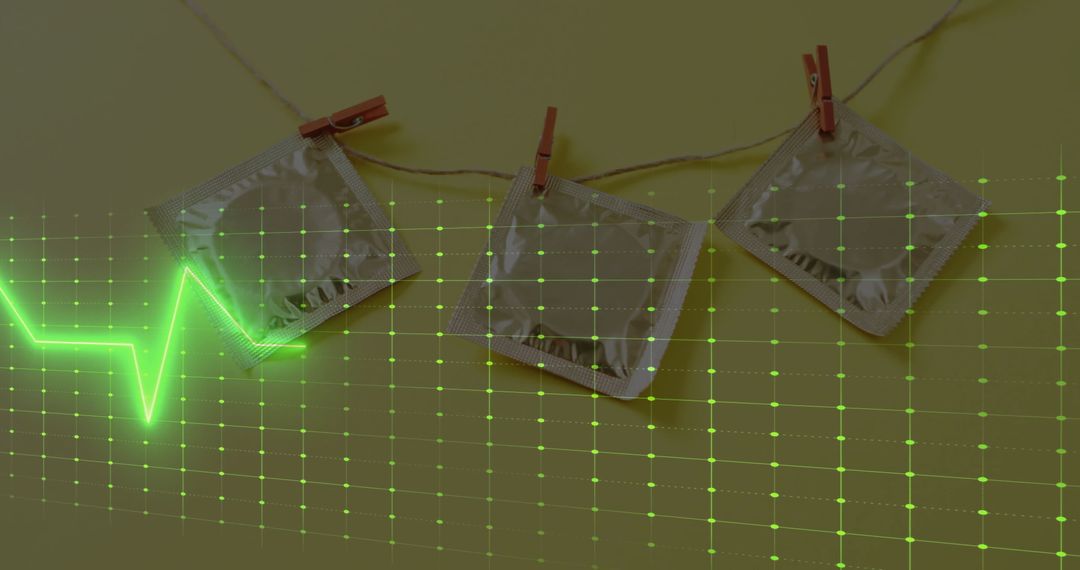
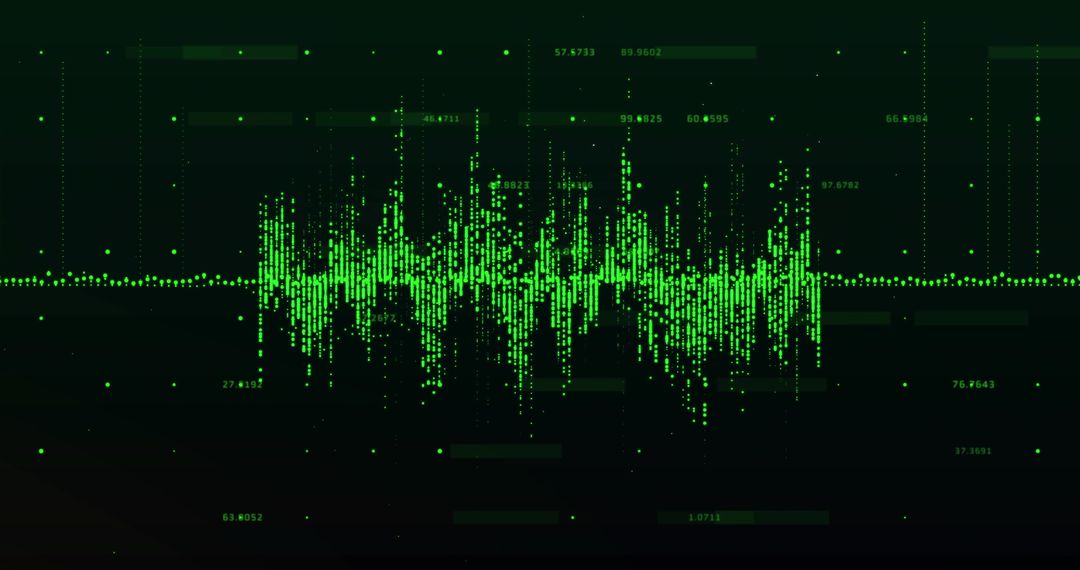
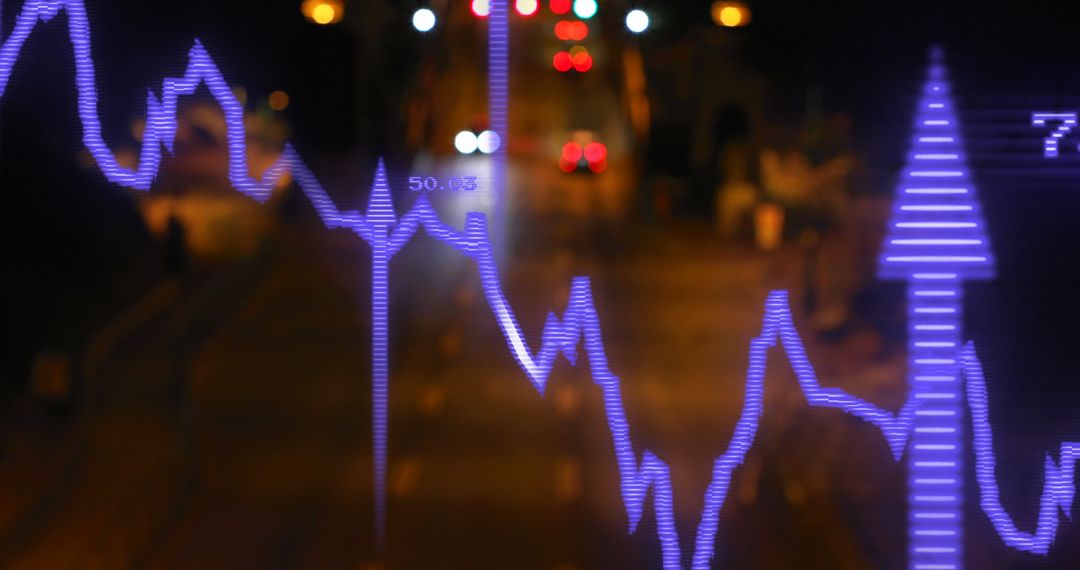
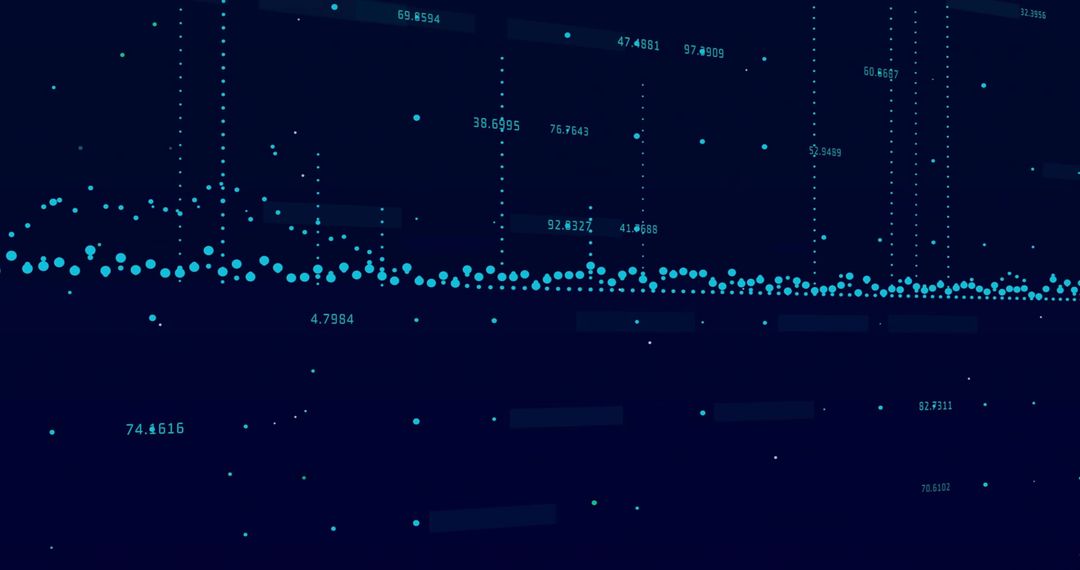
- Displaying dark financial data with layered bar charts, candlesticks and network graph
Displaying dark financial data with layered bar charts, candlesticks and network graph Image

Dark layered financial data visualization showing vertical bar charts, candlestick charts, gridlines and interconnected network nodes. Multiple translucent layers of numeric code and chart elements creating depth and abstract tech atmosphere. High contrast palette with muted tones and neon accents providing modern digital look. Graphic working well for fintech branding, trading platform headers, investment reports, financial blog thumbnails, business presentations and data science landing pages. Design allowing large headline or logo placement in open dark areas. Color overlay and blur adjustments working well for hero banners, website backgrounds or presentation slides. Cropping to landscape or square formats working for social posts and thumbnails. Consider overlaying transparent text boxes and data callouts for infographic use.
Powered by  - Get 15% off with code: PIKWIZARD15


0
downloads
downloads
Tags:
More
Credit Photo
If you would like to credit the Photo, here are some ways you can do so
Text Link
photo Link
<span class="text-link">
<span>
<a target="_blank" href=https://pikwizard.com/photo/displaying-dark-financial-data-with-layered-bar-charts-candlesticks-and-network-graph/2b89a5e162502439eca461d1d6f842dd/>PikWizard</a>
</span>
</span>
<span class="image-link">
<span
style="margin: 0 0 20px 0; display: inline-block; vertical-align: middle; width: 100%;"
>
<a
target="_blank"
href="https://pikwizard.com/photo/displaying-dark-financial-data-with-layered-bar-charts-candlesticks-and-network-graph/2b89a5e162502439eca461d1d6f842dd/"
style="text-decoration: none; font-size: 10px; margin: 0;"
>
<img src="https://pikwizard.com/pw/medium/2b89a5e162502439eca461d1d6f842dd.jpg" style="margin: 0; width: 100%;" alt="" />
<p style="font-size: 12px; margin: 0;">PikWizard</p>
</a>
</span>
</span>
Free (free of charge)
Free for personal and commercial use.
Author: Awesome Content
Similar Free Stock Images

Premium


Premium


Premium


Premium


Premium


Premium


Premium


Premium


Premium


Premium


Premium


Premium


Premium


Premium


Premium


Premium


Premium


Premium


Premium


Premium


Premium


Premium


Premium


Premium
