
- Home >
- Stock Photos >
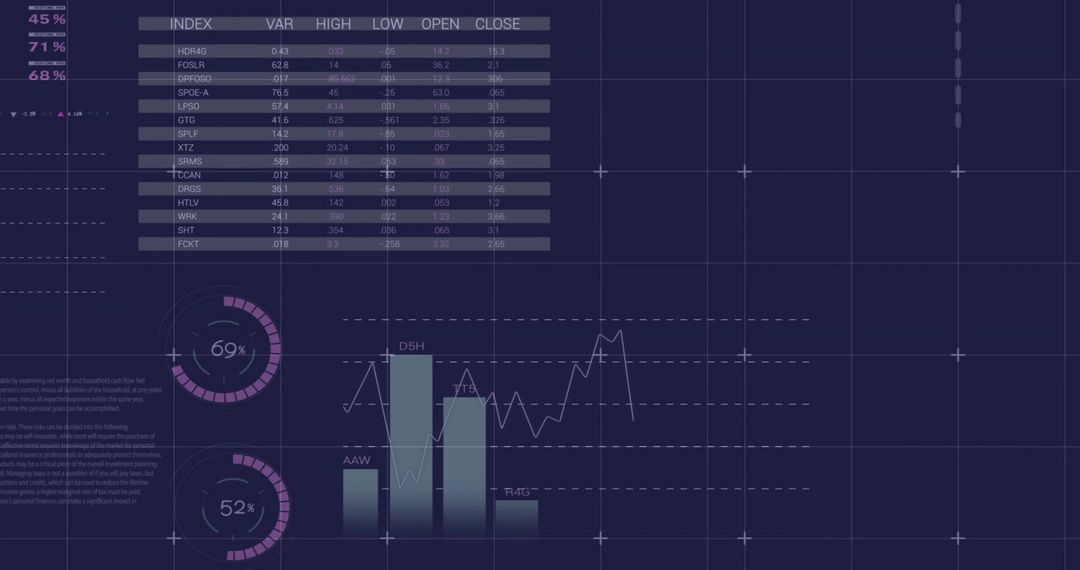
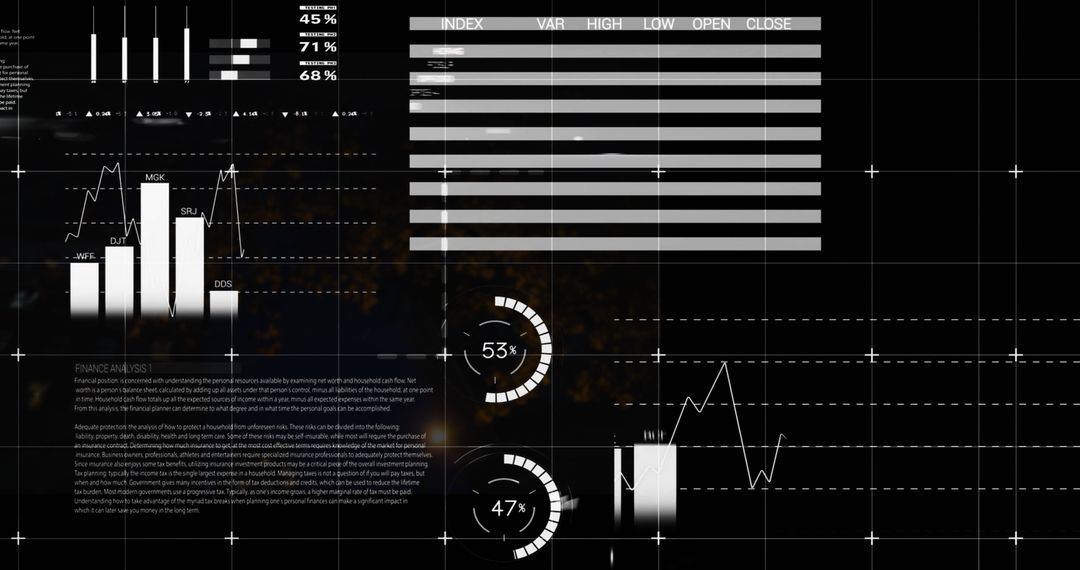
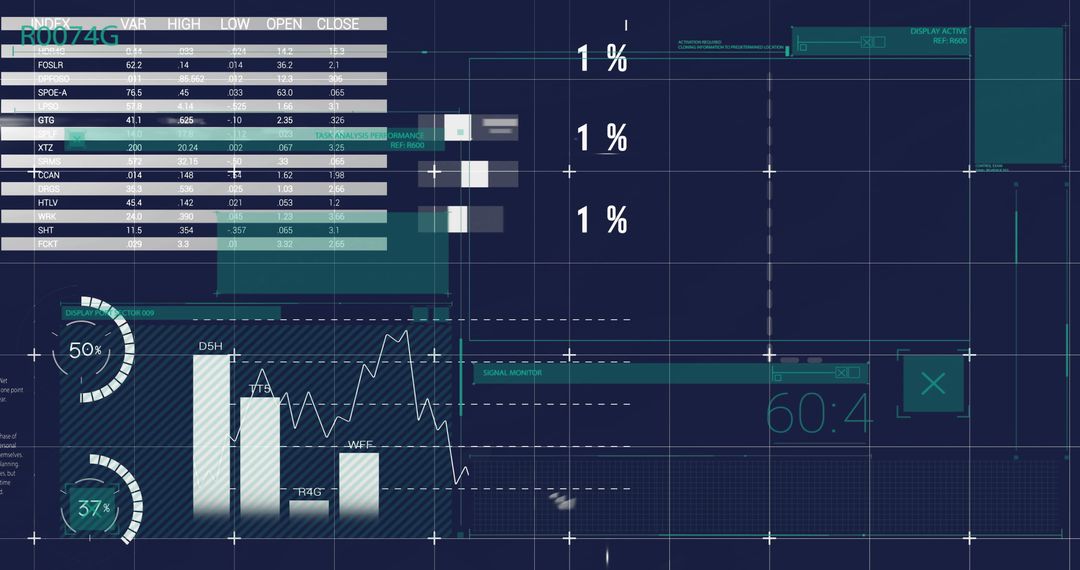
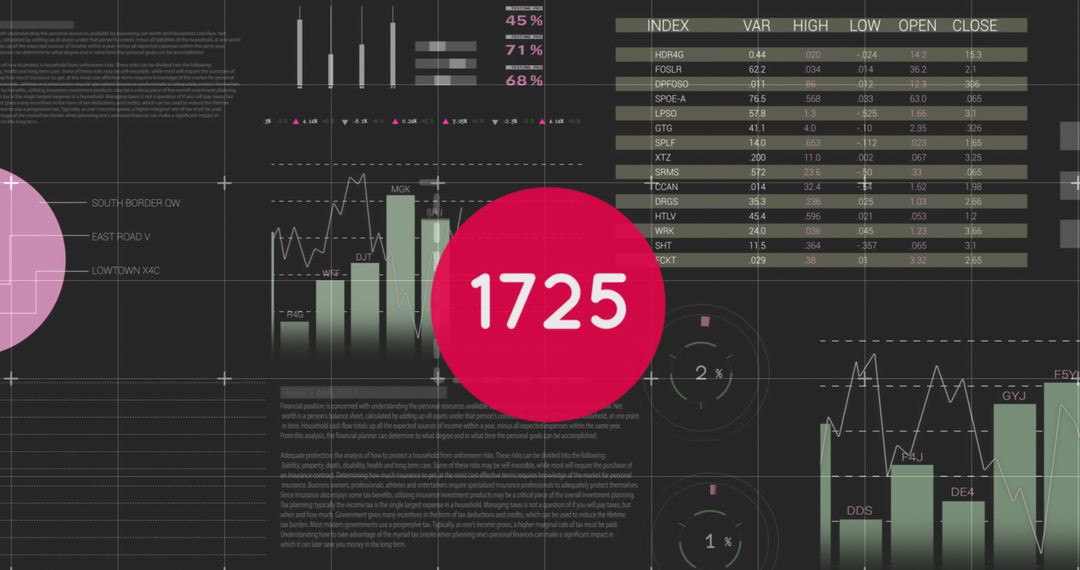
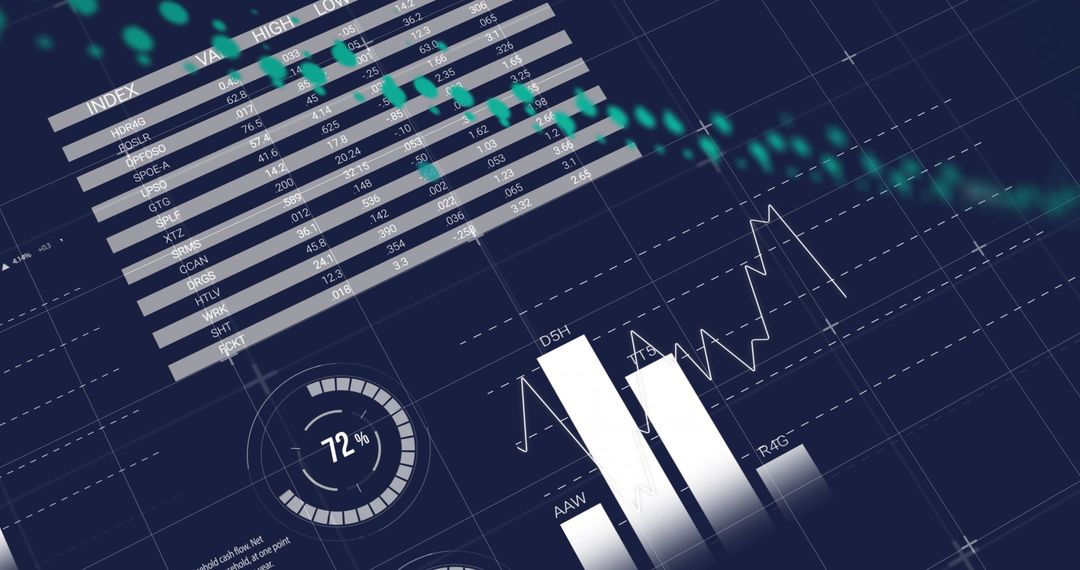
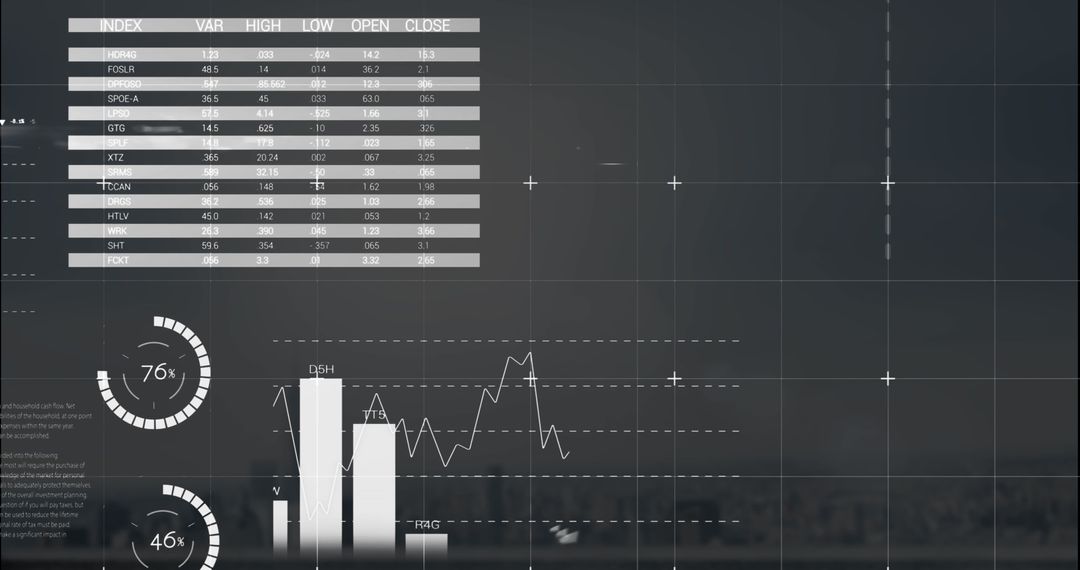
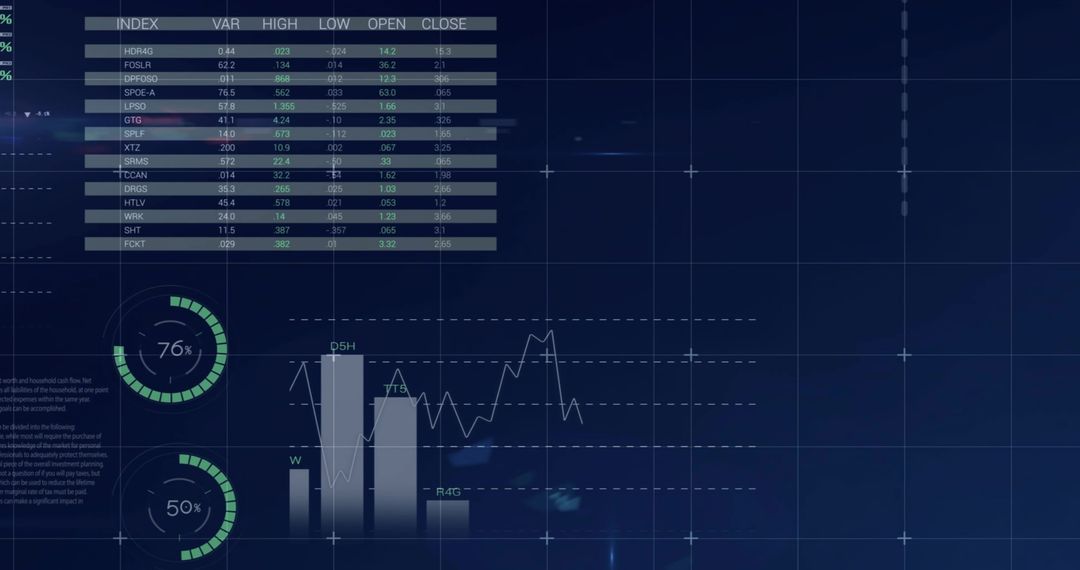
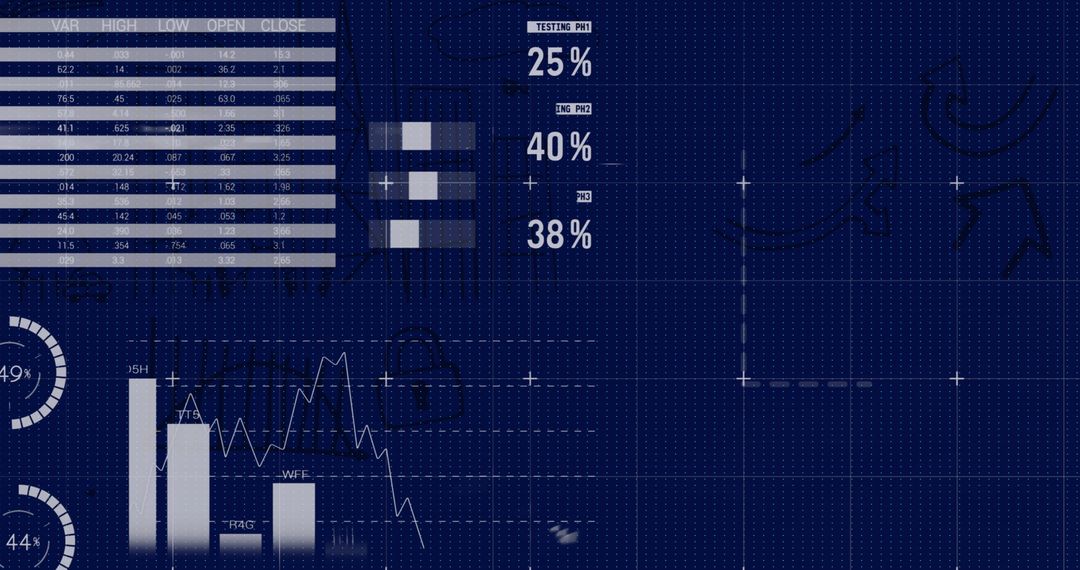
- Displaying data dashboard with circular progress rings, teal bars and lavender trend line
Displaying data dashboard with circular progress rings, teal bars and lavender trend line Image

Featuring left-aligned index table with labeled columns (INDEX, VAR, HIGH, LOW, OPEN, CLOSE), dual radial progress rings showing 69% and 52%, stacked teal bars and lavender trend line over dashed grid with crosshair markers. Using deep purple background and muted teal/lavender accents for modern low-contrast tech look. Conveying financial analytics, performance tracking, KPI monitoring, and UI prototype visuals. Ideal for financial reports, data dashboard presentations, investor pitch decks, business intelligence articles, analytics blog posts, UI/UX design portfolios, SaaS landing pages, training materials. Pairing well with headline text and overlayed statistics, cropping to focus on charts or table, or using full-width background behind product mockups. Customizing colors to match brand, replacing placeholder values with real data, animating rings and line for presentation, or using as static hero graphic for marketing materials. Providing clear visual hierarchy and calm color palette for professional tech and finance communications.
Powered by  - Get 15% off with code: PIKWIZARD15


0
downloads
downloads
Tags:
More
Credit Photo
If you would like to credit the Photo, here are some ways you can do so
Text Link
photo Link
<span class="text-link">
<span>
<a target="_blank" href=https://pikwizard.com/photo/displaying-data-dashboard-with-circular-progress-rings-teal-bars-and-lavender-trend-line/1d1f4fa891da717f81d82ee1812da79e/>PikWizard</a>
</span>
</span>
<span class="image-link">
<span
style="margin: 0 0 20px 0; display: inline-block; vertical-align: middle; width: 100%;"
>
<a
target="_blank"
href="https://pikwizard.com/photo/displaying-data-dashboard-with-circular-progress-rings-teal-bars-and-lavender-trend-line/1d1f4fa891da717f81d82ee1812da79e/"
style="text-decoration: none; font-size: 10px; margin: 0;"
>
<img src="https://pikwizard.com/pw/medium/1d1f4fa891da717f81d82ee1812da79e.jpg" style="margin: 0; width: 100%;" alt="" />
<p style="font-size: 12px; margin: 0;">PikWizard</p>
</a>
</span>
</span>
Free (free of charge)
Free for personal and commercial use.
Author: Authentic Images
Similar Free Stock Images

Premium


Premium


Premium


Premium


Premium


Premium


Premium


Premium


Premium


Premium


Premium


Premium


Premium


Premium


Premium


Premium


Premium


Premium


Premium


Premium


Premium


Premium


Premium


Premium

