- Home >
- Stock Photos >
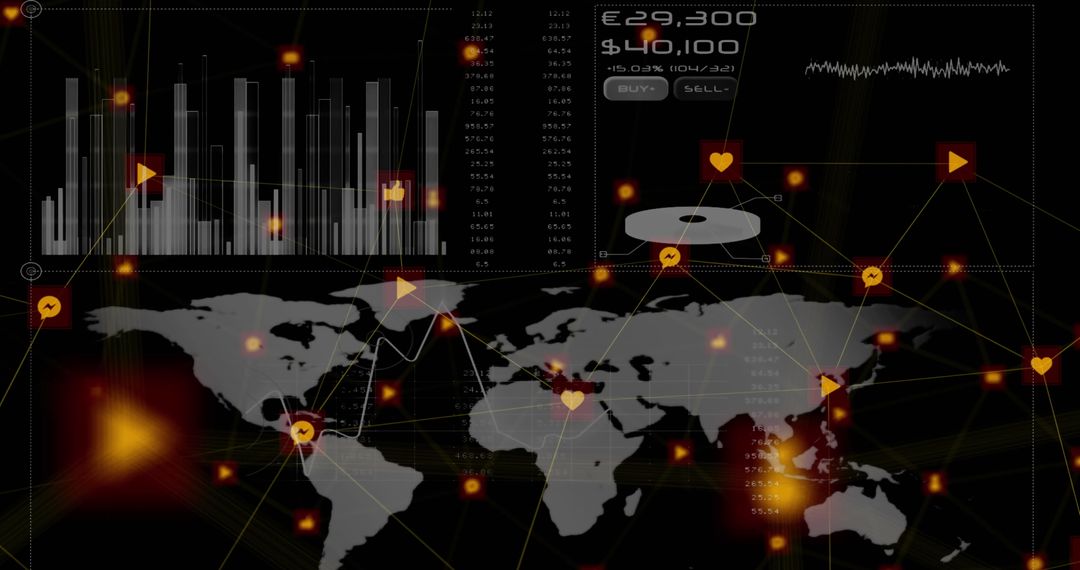
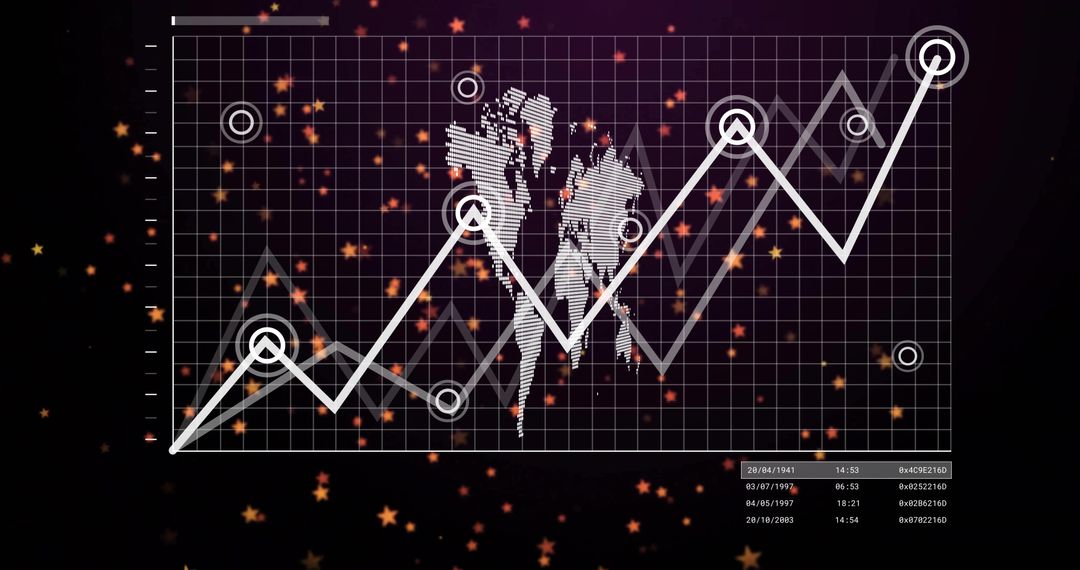
- Displaying data visualization dashboard with neon bokeh, rising analytics graph markers
Displaying data visualization dashboard with neon bokeh, rising analytics graph markers Image

Showing dynamic grid with ascending white line graph and circular data nodes over warm neon bokeh field. Featuring pie chart icon, bar chart elements, and folder icons suggesting organized data and report management. Providing dark maroon palette with yellow and orange highlights for modern futuristic tech look. Working well for corporate presentations, fintech websites, analytics dashboards, investor reports, marketing headers, conference banners, and social media posts. Allowing ample left-side space for headline text or logo overlays and supporting full-bleed hero background crops. Pairing well with bold sans serif typography and white or neon accent colors. Delivering energetic visual for topics such as business growth, market trends, big data analysis, financial forecasting, and performance metrics.
Powered by  - Get 15% off with code: PIKWIZARD15


0
downloads
downloads
Tags:
More
Credit Photo
If you would like to credit the Photo, here are some ways you can do so
Text Link
photo Link
<span class="text-link">
<span>
<a target="_blank" href=https://pikwizard.com/photo/displaying-data-visualization-dashboard-with-neon-bokeh-rising-analytics-graph-markers/9ca33dd74d6853e961d6d93d98145fc3/>PikWizard</a>
</span>
</span>
<span class="image-link">
<span
style="margin: 0 0 20px 0; display: inline-block; vertical-align: middle; width: 100%;"
>
<a
target="_blank"
href="https://pikwizard.com/photo/displaying-data-visualization-dashboard-with-neon-bokeh-rising-analytics-graph-markers/9ca33dd74d6853e961d6d93d98145fc3/"
style="text-decoration: none; font-size: 10px; margin: 0;"
>
<img src="https://pikwizard.com/pw/medium/9ca33dd74d6853e961d6d93d98145fc3.jpg" style="margin: 0; width: 100%;" alt="" />
<p style="font-size: 12px; margin: 0;">PikWizard</p>
</a>
</span>
</span>
Free (free of charge)
Free for personal and commercial use.
Author: People Creations
Similar Free Stock Images

Premium


Premium


Premium


Premium


Premium


Premium


Premium


Premium


Premium


Premium


Premium


Premium


Premium


Premium


Premium


Premium


Premium


Premium


Premium


Premium


Premium


Premium


Premium


Premium