- Home >
- Stock Photos >
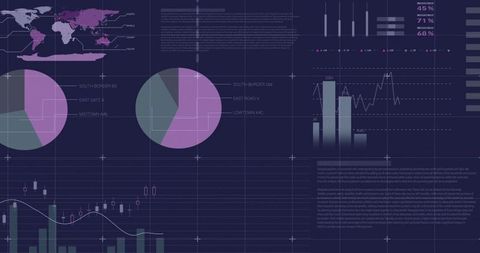
- Displaying digital analytics dashboard with large numeric data and pie chart on navy grid
Displaying digital analytics dashboard with large numeric data and pie chart on navy grid Image

Dark navy analytics dashboard displaying oversized digits, circular pie chart with muted red and gray segments, vertical percentage bars in bright red, and faint grid overlay. Diagonal composition creating strong sense of motion and layered data hierarchy. High contrast between white numeric labels and dark background improving legibility. Clean geometric blocks suggesting technical, corporate aesthetic. Ideal for tech and finance projects: enhancing presentation slides, supporting website hero headers, illustrating analytics reports, enhancing marketing collateral, creating social media banners, backing pitch decks and fintech promotions. Suitable for editorial use on data trends, business intelligence articles, and UI/UX mockups. Providing visual emphasis for metrics, KPI highlights, revenue dashboards, and big data concepts.

downloads
Credit Photo
If you would like to credit the Photo, here are some ways you can do so
Free (free of charge)
Free for personal and commercial use.
Author: Awesome Content