
- Home >
- Stock Photos >
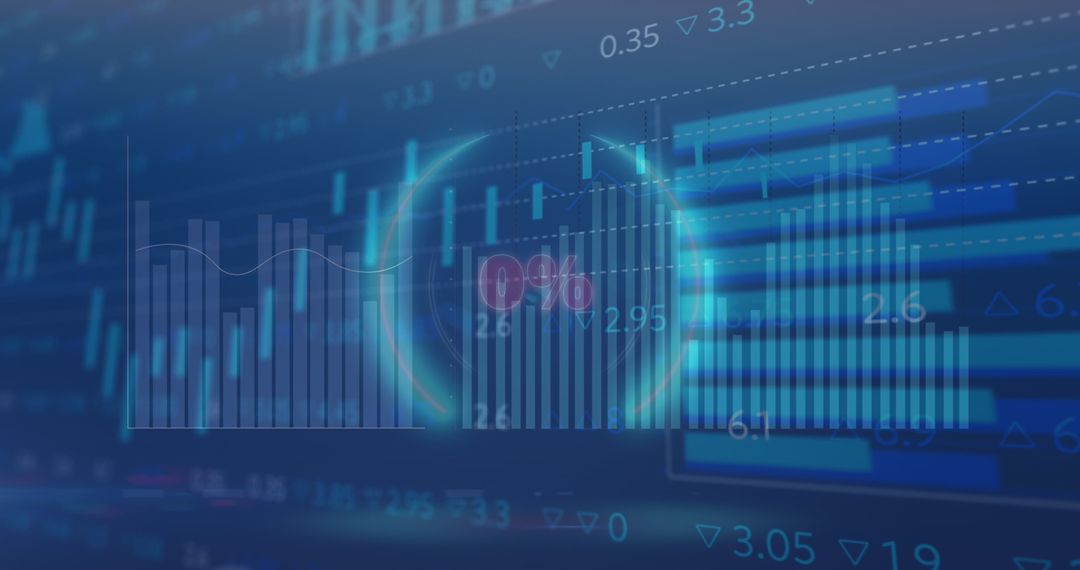
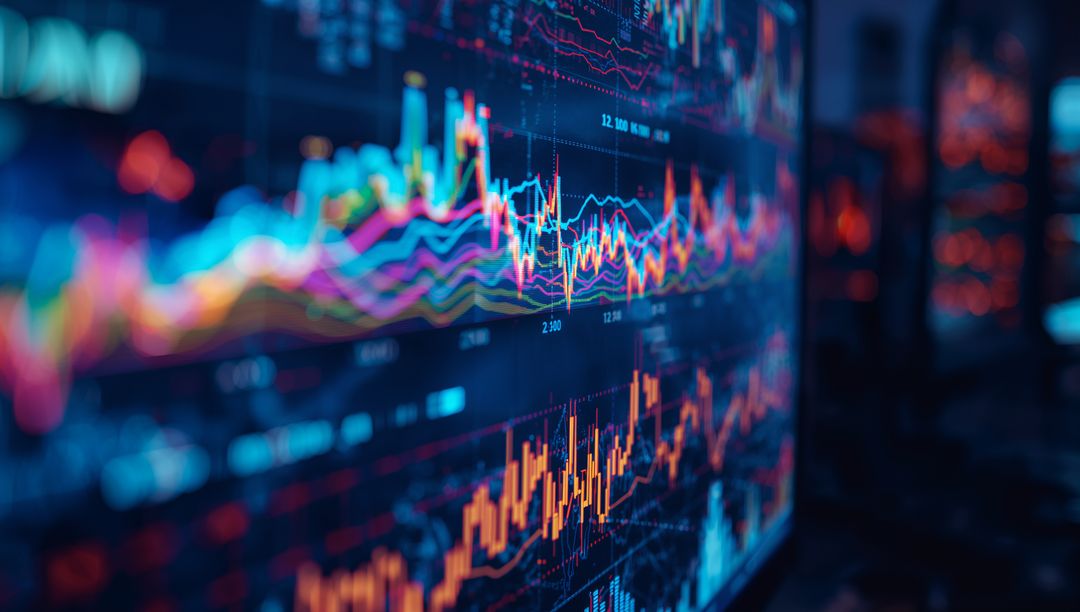
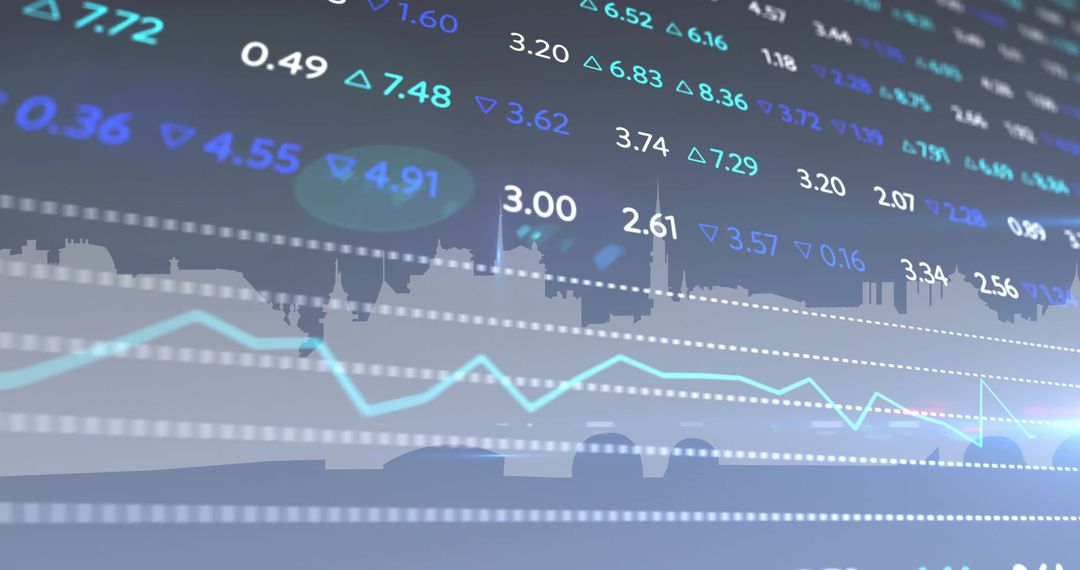
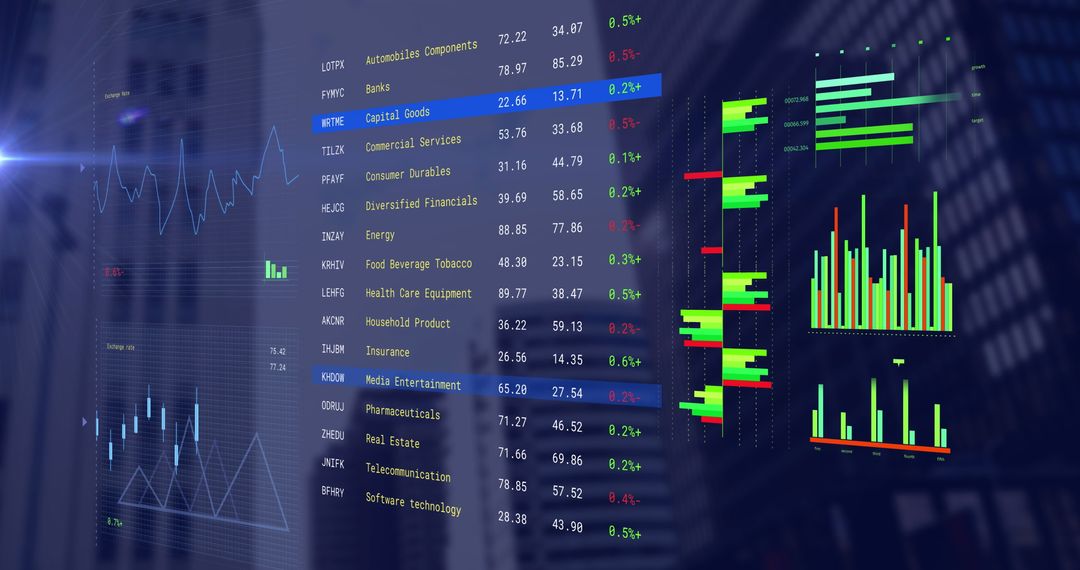
- Displaying digital trading dashboard visualizing realtime market data and candlestick charts
Displaying digital trading dashboard visualizing realtime market data and candlestick charts Image

Featuring layered candlestick, bar and line graphics with blue-red gradient, conveying realtime market movement and analytics. Ideal for fintech landing pages, trading platform demos, investor presentations, financial reports, analytics dashboards, social media campaigns and blog headers. Recommended uses include hero banners, slide decks, editorial illustrations, data visualization tutorials and UI mockups. Color palette and high-tech aesthetic supporting themes of volatility, growth, analysis and performance monitoring. Providing strong visual anchor for marketing, client reports, training materials and product demos.
Powered by  - Get 15% off with code: PIKWIZARD15


0
downloads
downloads
Tags:
More
Credit Photo
If you would like to credit the Photo, here are some ways you can do so
Text Link
photo Link
<span class="text-link">
<span>
<a target="_blank" href=https://pikwizard.com/photo/displaying-digital-trading-dashboard-visualizing-realtime-market-data-and-candlestick-charts/934718a46632ec12f98365982a313aed/>PikWizard</a>
</span>
</span>
<span class="image-link">
<span
style="margin: 0 0 20px 0; display: inline-block; vertical-align: middle; width: 100%;"
>
<a
target="_blank"
href="https://pikwizard.com/photo/displaying-digital-trading-dashboard-visualizing-realtime-market-data-and-candlestick-charts/934718a46632ec12f98365982a313aed/"
style="text-decoration: none; font-size: 10px; margin: 0;"
>
<img src="https://pikwizard.com/pw/medium/934718a46632ec12f98365982a313aed.jpg" style="margin: 0; width: 100%;" alt="" />
<p style="font-size: 12px; margin: 0;">PikWizard</p>
</a>
</span>
</span>
Free (free of charge)
Free for personal and commercial use.
Author: People Creations
Similar Free Stock Images

Premium


Premium


Premium


Premium


Premium


Premium


Premium


Premium


Premium


Premium


Premium


Premium


Premium


Premium


Premium


Premium


Premium


Premium


Premium


Premium


Premium


Premium


Premium


Premium

