
- Home >
- Stock Photos >
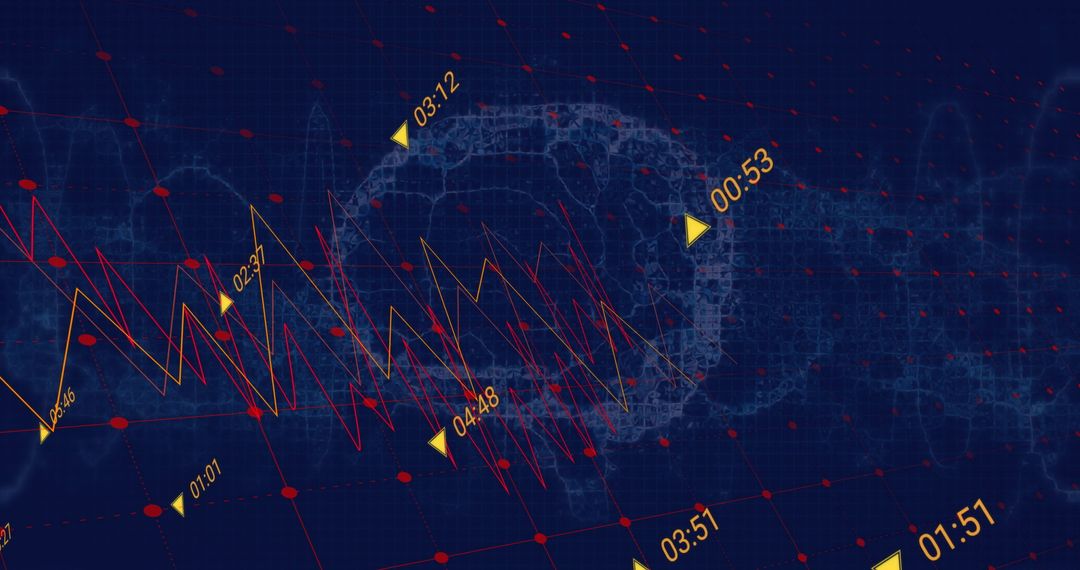
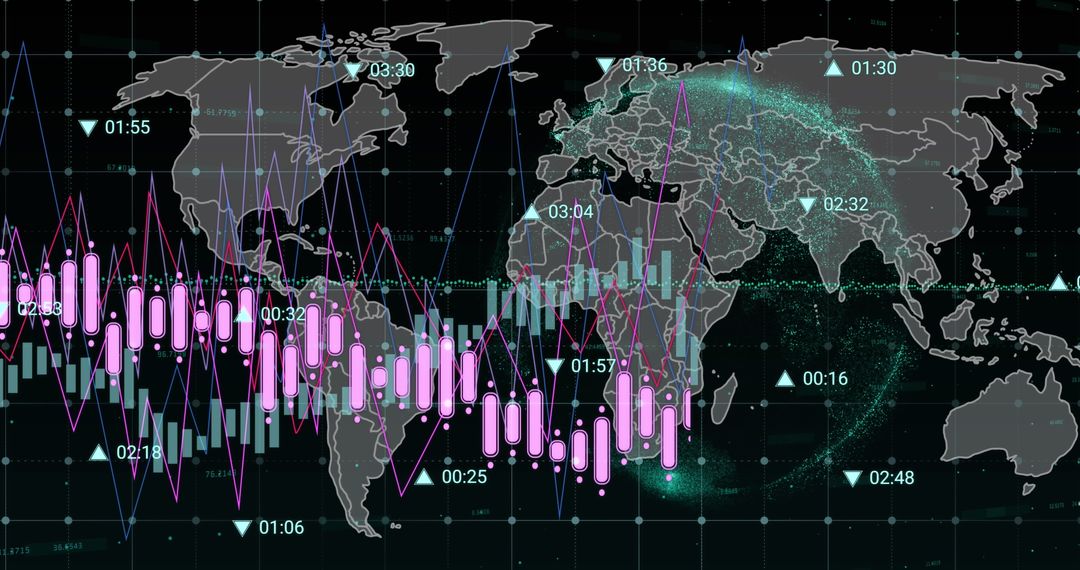
- Displaying dotted global map and digital globe, neon financial line charts glowing red endpoint
Displaying dotted global map and digital globe, neon financial line charts glowing red endpoint Image

Showing dotted world map and digital globe on dark grid with neon teal and red line charts tracking trend toward glowing red endpoint. Creating modern high-tech mood suitable for finance, technology, and analytics themes. Ideal for hero banners on fintech websites, headers for analytics reports, backgrounds for investor presentations, social media campaign artwork, marketing materials, and UI mockups for data dashboards. Suggestions for customization: change color palette to match brand, overlay bold headline text, crop to widescreen or square formats, add logo mark for branding. Use for slide decks, annual reports, blog headers, app landing pages, ad creatives, newsroom data stories, and exhibition displays.
Powered by  - Get 15% off with code: PIKWIZARD15


0
downloads
downloads
Tags:
More
Credit Photo
If you would like to credit the Photo, here are some ways you can do so
Text Link
photo Link
<span class="text-link">
<span>
<a target="_blank" href=https://pikwizard.com/photo/displaying-dotted-global-map-and-digital-globe-neon-financial-line-charts-glowing-red-endpoint/5946200ac0f7d9f790fef5433af8972d/>PikWizard</a>
</span>
</span>
<span class="image-link">
<span
style="margin: 0 0 20px 0; display: inline-block; vertical-align: middle; width: 100%;"
>
<a
target="_blank"
href="https://pikwizard.com/photo/displaying-dotted-global-map-and-digital-globe-neon-financial-line-charts-glowing-red-endpoint/5946200ac0f7d9f790fef5433af8972d/"
style="text-decoration: none; font-size: 10px; margin: 0;"
>
<img src="https://pikwizard.com/pw/medium/5946200ac0f7d9f790fef5433af8972d.jpg" style="margin: 0; width: 100%;" alt="" />
<p style="font-size: 12px; margin: 0;">PikWizard</p>
</a>
</span>
</span>
Free (free of charge)
Free for personal and commercial use.
Author: Awesome Content
Similar Free Stock Images

Premium


Premium


Premium


Premium


Premium


Premium


Premium


Premium


Premium


Premium


Premium


Premium


Premium


Premium


Premium


Premium


Premium


Premium


Premium


Premium


Premium


Premium


Premium


Premium

