1. Home > 
  2. Stock Photos > 
  3. Displaying Energy Market Analytics with Candlestick Charts, Histograms and Oil Pump Jack

Displaying Energy Market Analytics with Candlestick Charts, Histograms and Oil Pump Jack Image

Displaying Energy Market Analytics with Candlestick Charts, Histograms and Oil Pump Jack

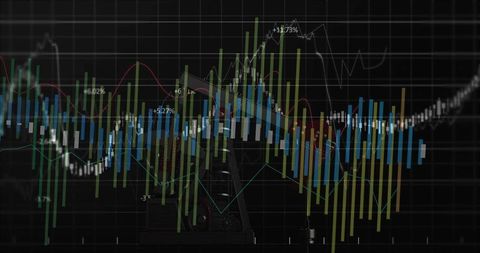
Display combining dark trading terminal backdrop with layered candlestick charts, colored histograms, trend lines and oil pump jack silhouette, conveying energy commodities market dynamics. High-contrast color palette using blues, greens and yellows, enhancing data readability on dark grid. Suiting finance and energy content, including website hero banners, report covers, presentation slides, blog headers, social posts, trading platform UI demos and marketing for commodity investment products. Illustrating crude oil price analysis, commodities research, market volatility discussions, trading strategy articles and fintech dashboards. Offering space for headline and data overlay at top or right side when cropping for web or print. Delivering modern technical look for corporate communications and editorial stories.

Powered by Adobe logo
Closeup financial chart with uptrend line candlestick graph in stock market on blue color monitor background - Powered by AdobeStock market and trading, digital graph - Powered by AdobeRed and yellow financial graph descending against blue background with bokeh lights stock market trading - Powered by AdobePerspective view of stock market growth, business investing and data concept with digital financial chart graphs, diagrams and indicators on dark blue blurry background. 3D rendering - Powered by AdobeFinance trade manager analysing stock market indicators for best investment strategy, financial data and charts with business buildings in background - Powered by Adobe

Credit Photo

If you would like to credit the Photo, here are some ways you can do so

Free (free of charge)

Free for personal and commercial use.

Author: People Creations

Similar Free Stock Images

Digital Finance Analytics with Stock Market Data
Premium
Finance.
Financial Data Analysis with Dynamic Graph on Blue Background
Dynamic Financial Graphs Over Cityscape Background
Abstract Digital Chart on Black Background Representing Data Analysis
Financial Data Flow against Urban Skyline Backdrop
Premium
Financial advisor explaining invest stock market data consulting investor. Two busy business men analysts doing finance trading analysis pointing at exchange chart on laptop screen working in office.
Economic Trends Analysis with Financial Indicators and Graphs
Digital Financial Data with Graph and Grid Patterns
Dynamic Financial Charts and Graphs Indicating Market Trends
Digital Graphs Representing Data and Analytics on Black Background
Premium
Financial growth chart for stock market investment trading.
Dynamic Digital Market Analysis with Holographic Data
Dynamic Forex Trading Graphs with Increasing Numbers
Digital Data Visualization with Trend Lines and Percentage Changes
Colorful Bar Graph with Data Overlay on Black Background
Premium
Magnifying glass focusing on candlestick chart, showcasing market analysis on a dark background, concept for financial review, investment strategy and business intelligence data analysis
Digital Graph with Rising and Falling Lines on Grid Background
Dynamic Financial Graphs and Data Analysis Interface
Abstract Economy Concept with Graph and Urban Scenes
Digital Data and Financial Charts on White Background
Premium
Illustration of trading floor, stock market exchange indoor backgrounds with round workplaces and displays showing financial data. Businesspeople.
Abstract Financial Data Charts Reflecting Economic Trends
Abstract Data Visualization Digital Chart Background
Digital Financial Data Graph on Black Screen Background
Candlestick Chart Visualization with Indicators and Growth Highlight
Premium
Hand interacting with financial stock market trading candlestick charts analyzing growth opportunities and investment strategies
Dynamic Digital Stock Market Analysis Chart Visual
Dynamic Financial Graph Displaying Market Trends with Bar and Line Charts
Candlestick Chart Displaying Market Trends with Analytical Lines
Realtime Trading Dashboard Showing Green Candlestick Chart with Technical Indicators and Volume
Rising Stock Market Trend with Digital Data Analytics
Financial Data Analysis with Growth Trend Arrows on Digital Interface
Premium
Stock market trading chart and analyzing investment opportunity. Broker touching stock exchange price graphs.
Abstract Digital Data Network with Graphs and Symbols
Economic and Political Factors Influence Investment Trends
Dynamic Financial Graphs Illustrating Market Trends
Data Analytics and Financial Growth Indicators
Premium
Business finance and investment concept, Capital gain world money economic growth. coin stack financial graph chart, market report on cash currency concept...
Dynamic Stock Market Graphs and Financial Data
Dynamic Financial Growth Digital Chart Display
Rising Graphs and Interactive Financial Data Analytics Background
Dynamic Financial Data Chart Display with Graphical Analysis
Premium
Stock market graph with blue technology background, financial trading analysis chart, investment growth data visualization, economic business concept
Financial Data Analysis with Bar and Line Graph Elements
Financial Data Analysis in Digital Interface with Graphs
Financial Graphs with Social Media Analytics on Digital Chart
Abstract Financial Data Visualization with Graphs
Premium
Business people, stock market and night with computer for profit, financial growth or increase at office. Businessman, woman or brokers with tech screen or display for online trading or investment
Inflation Analytics: Graphic Representation of Stock Market Trends
Data Analysis Graphics on Digital Grid Background
Dynamic Stock Market Analysis Concept Artwork
Tech Growth Analysis with Dynamic Data Visualization
Premium
Digital forex and stock market chart with upward arrows and glowing data on dark screen background showing financial growth trends. 3D Rendering
Abstract Digital Data Graph and Diagrams on Gray Background
Analyzing Stock Market Trends with Candlestick Chart and Data Visualization
Financial Growth Chart with Data Visualization Elements
Dynamic Financial Chart on Digital Dashboard
Premium
Close-up view of a financial data chart showing market analytics and stock trading trends with a blurred background.
Futuristic Financial Dashboard with Analytics and Data Visualization
Advanced Data Visualization on Finance Dashboard
Neon Candlestick Trading Chart Visualizing Market Trends, Financial Data and Analytics
Dynamic Financial Data Graphs Networking in Global Business
Financial Data Processing Visualization with Colorful Bar Charts
Financial Data Overlay on Cityscape Visualizing Market Trends
Premium
Abstract financial stock market graph with candlestick bars isolated on transparent background
Financial Data Charts with World Map on Blue Digital Background
Rising Digital Graph and Data Visualizations on Black Background
Futuristic Global Business Data with Digital Interface
Digital Finance: Modern Stock Market Analysis Display
Premium
Night cityscape backdrop with dynamic stock market graph overlaid
Financial Data Analysis Displayed on Server Infrastructure
Holographic Financial Graph with Dynamic Line Chart
Financial Data Analysis with Code Interface on Black Background
High-Tech Financial Data Analysis Display with Graphs
Premium
Data of stock market.  Financial analyst pointing candlestick chart.
Abstract Data Visualization with Dynamic Charts and Graphs
Rising Financial Data Graph on Digital Grid Background
Digital Financial Data Visualization with Bar Graphs and Line Charts
Data Visualization on Security Shield Interface for Cyber Security
Premium
Widescreen Abstract financial graph with uptrend line and bar chart of stock market on blue color background
Financial Data Analysis on Blue Digital Interface
Analyzing Financial Data on Digital World Map Background
Real-Time Financial Data Analysis with Graphs and Charts
Fluctuating Financial Graph on Green Grid Background
Premium
Business financial chart with moving up arrow graph.Financial data charts with glowing stock market graphs.Stock market investment data and analysis finance graph.
Futuristic Data Visualization with Dynamic Graphs and Digital Globe
Modern Financial Analysis Display with Dynamic Bar and Line Graphs
Red Line Graph Displaying Complex Digital Trend Analysis
Dynamic Financial Graph with Candlestick Patterns and Percentage Metrics
Premium
Stock market bull trading up, bullish. Symbolizing rising stock market, uptrend. Green colored. Abstract, modern concept of wall street business, bull market trader, crypto currency trading.
Visualizing market volatility on navy gradient with magenta and blue trend lines, copy space
Candlestick trading chart displaying trend lines, indicators and percentage labels
Digital Financial Data with Arrows Indicating Growth
Dynamic Financial Data Graph on Blue Digital Background
Financial Data Visualization with Cityscape Overlay
Abstract Financial Graph On Black Background Representing Data Analysis
Premium
Blurred scene of people in a city looking at a digital stock market display, indicating real-time trading data with glowing numerical values.
Financial Stock Market Data Analysis on Digital Interface
Futuristic Data Processing Animation with Media Icons
Fluctuating Digital Stock Market Data Chart
Data Security with Tech Bar Graph Overlay
Premium
Orange financial charts over city skyline at sunset stock market trading
Global Finance and COVID-19 Impact Representation
Digital Interface with Data Graphs and Charts on Blue Background
Abstract Digital Financial Data Chart with Pink Line Oscillations
Dynamic Financial Data Analysis in Digital Interface
Premium
female hand holding smartphone, business style, stocks and exchanges, professional photo
Dynamic Financial Data Visualization on Digital Grid Background
Holographic Financial Data Visualization with Stock Trends
Dynamic Financial Data Against Urban Skyline
Digital Cityscape with Financial Data Overlay
Premium
Financial market data analysis with glowing 3D bar and line charts on dark background showing economic trends and growth concept visualization. 3D Rendering
Financial Data Analysis with Interactive Graphs
Dynamic Financial Data Overlaid on Grid Background
Abstract Financial Data Processing and Analysis Interface
Dynamic Graphic of Financial Data Displayed on Graph
Premium
Green arrow pointing upward on financial graph. Business growth chart with rising trend line. Digital stock market data visualization for investment analysis
Trend Analysis with Candlestick Chart and Data Indicators
Green Fluctuating Line Graph on Digital Grid for Financial Analysis
Dynamic Data Dashboard with Multicolored Trendlines and Chart Bars
Digital Financial Analytics with Red Trends on Grid Screen
Premium
Business graph or chart stock market or forex trading graph in graphic concept suitable for financial investment or Economic trends business
Multiseries Financial Market Chart Showing Rising Green Trend Candlesticks and Percent Labels