- Home >
- Stock Photos >
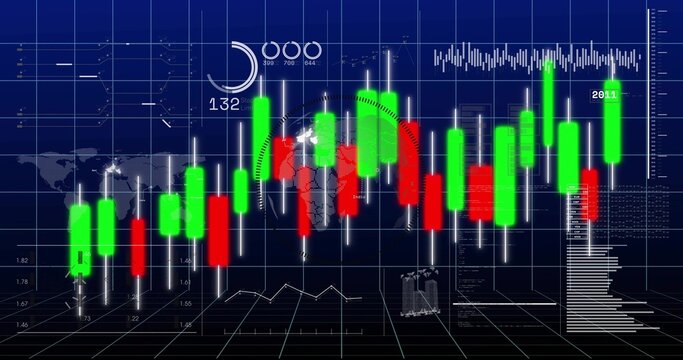
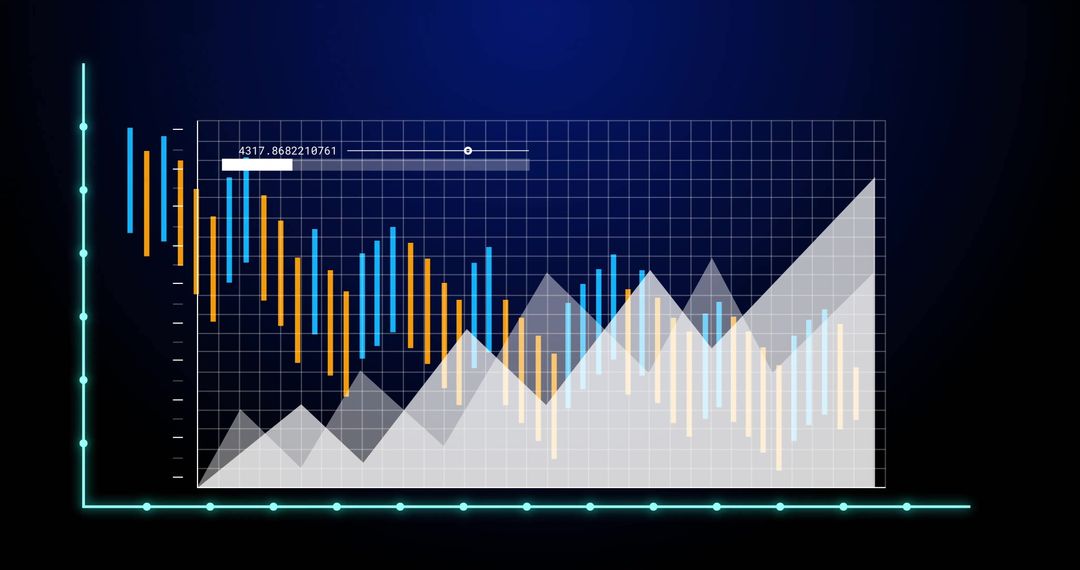
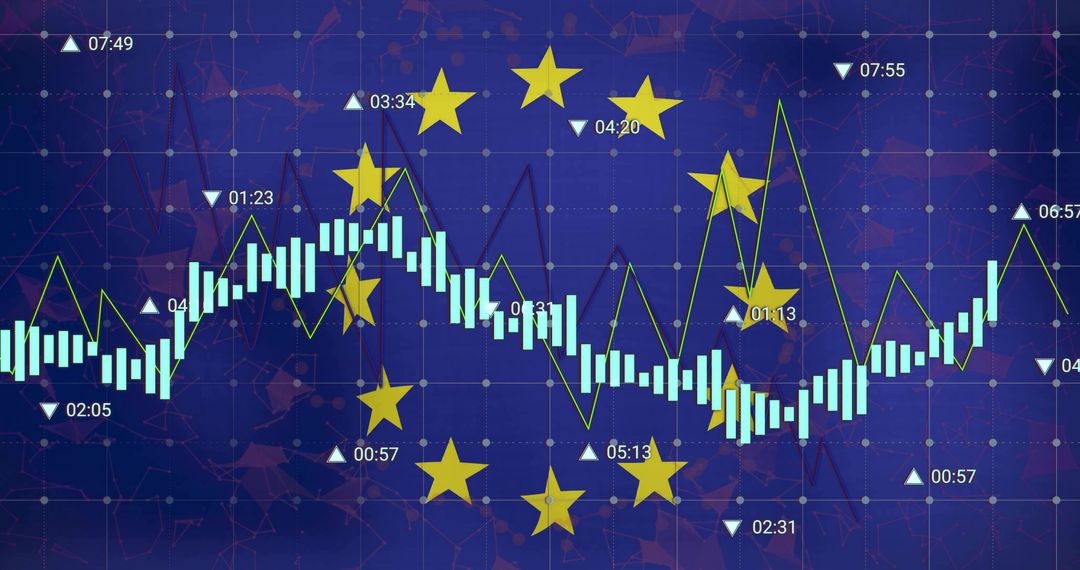
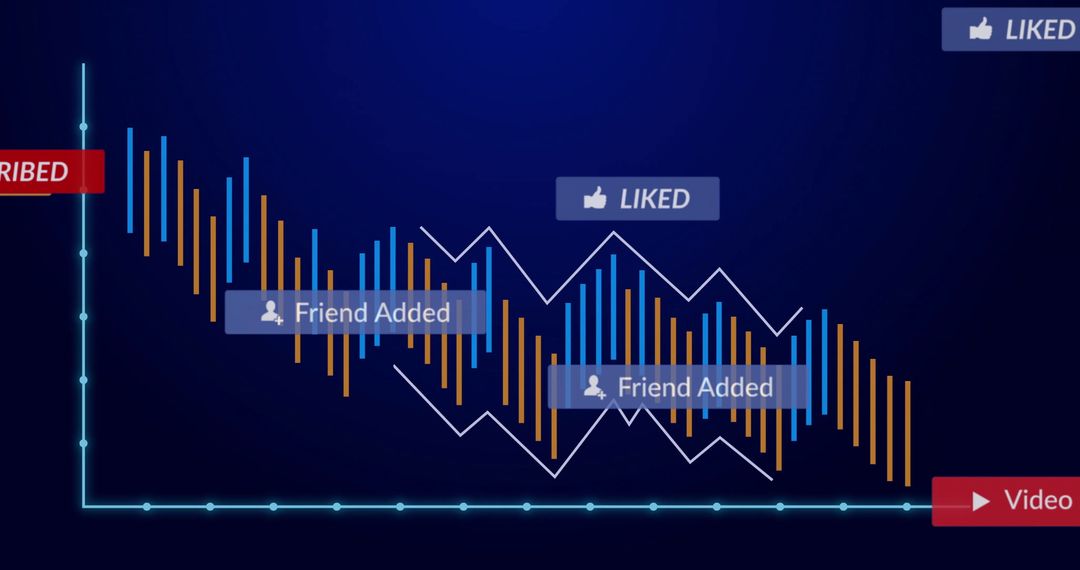
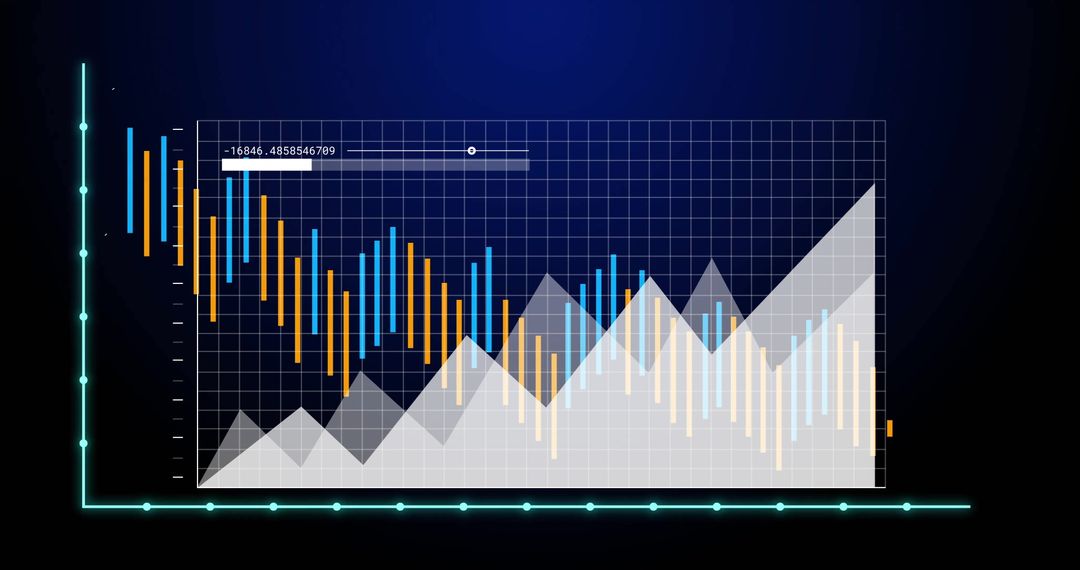
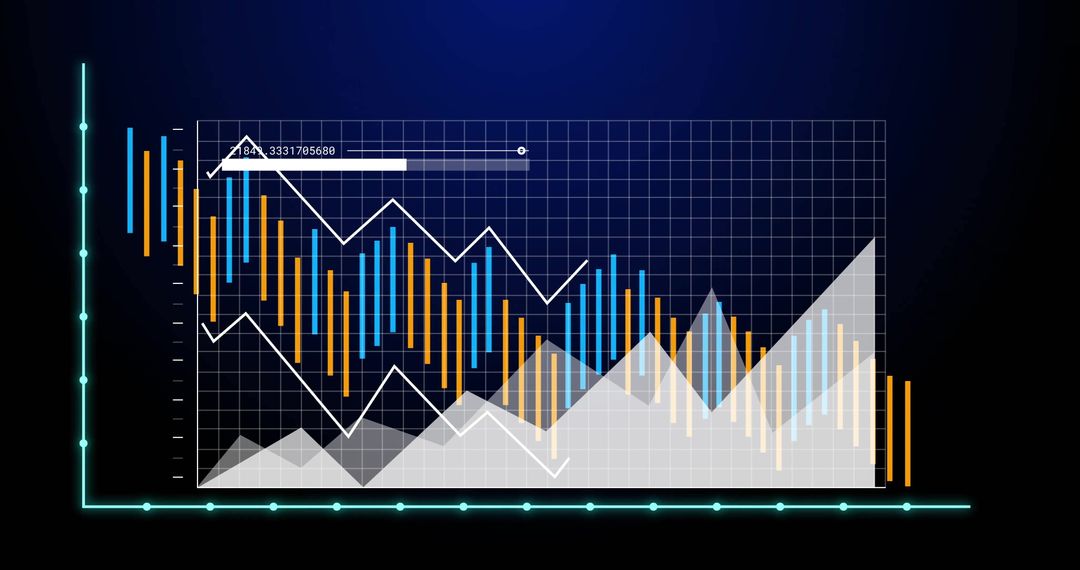
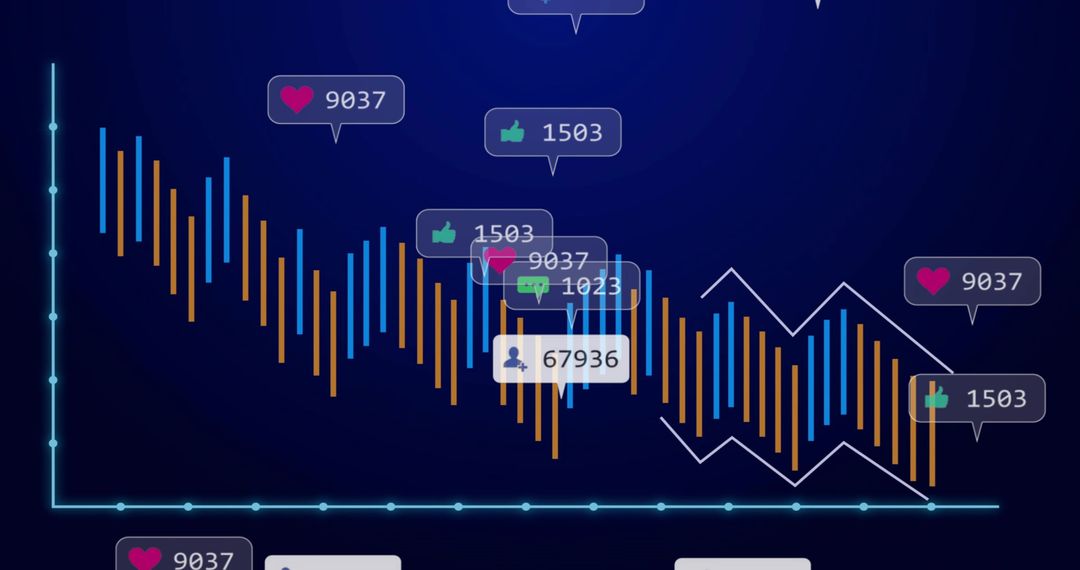
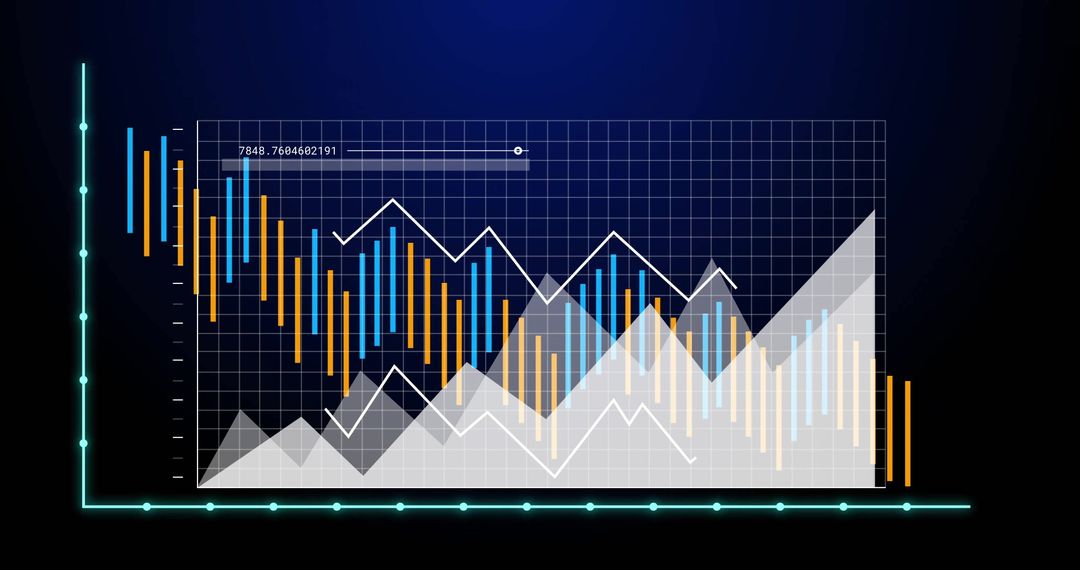
- Displaying Falling Candlestick Chart on Dark Data Dashboard with Teal Axis and Metrics
Displaying Falling Candlestick Chart on Dark Data Dashboard with Teal Axis and Metrics Image

Showing falling candlestick series on dark dashboard with teal axis, blue and orange bars, labeled badges, and numeric annotations. Including grid lines and subtle data points for visual clarity. Serving fintech, trading, investment, and analytics teams for illustrating market downtrend, performance reports, technical analysis, and UI mockups. Working well as hero graphic for fintech websites, slide deck background for investor presentations, blog header for market commentary, and app prototype showcase. Highlighting contrast between bullish and bearish bars, plus social engagement badges and user icon for combining market data with audience metrics. Offering clean composition and high-contrast colors for legibility on dark screens.
Powered by 


0
downloads
downloads
Tags:
More
Credit Photo
If you would like to credit the Photo, here are some ways you can do so
Text Link
photo Link
<span class="text-link">
<span>
<a target="_blank" href=https://pikwizard.com/photo/displaying-falling-candlestick-chart-on-dark-data-dashboard-with-teal-axis-and-metrics/2cc3b998617ccfa706a772662a5ae01e/>PikWizard</a>
</span>
</span>
<span class="image-link">
<span
style="margin: 0 0 20px 0; display: inline-block; vertical-align: middle; width: 100%;"
>
<a
target="_blank"
href="https://pikwizard.com/photo/displaying-falling-candlestick-chart-on-dark-data-dashboard-with-teal-axis-and-metrics/2cc3b998617ccfa706a772662a5ae01e/"
style="text-decoration: none; font-size: 10px; margin: 0;"
>
<img src="https://pikwizard.com/pw/medium/2cc3b998617ccfa706a772662a5ae01e.jpg" style="margin: 0; width: 100%;" alt="" />
<p style="font-size: 12px; margin: 0;">PikWizard</p>
</a>
</span>
</span>
Free (free of charge)
Free for personal and commercial use.
Author: Creative Art
Similar Free Stock Images

Premium


Premium


Premium


Premium


Premium


Premium


Premium


Premium


Premium


Premium


Premium


Premium


Premium


Premium


Premium


Premium


Premium


Premium


Premium


Premium


Premium


Premium


Premium


Premium