- Home >
- Stock Photos >
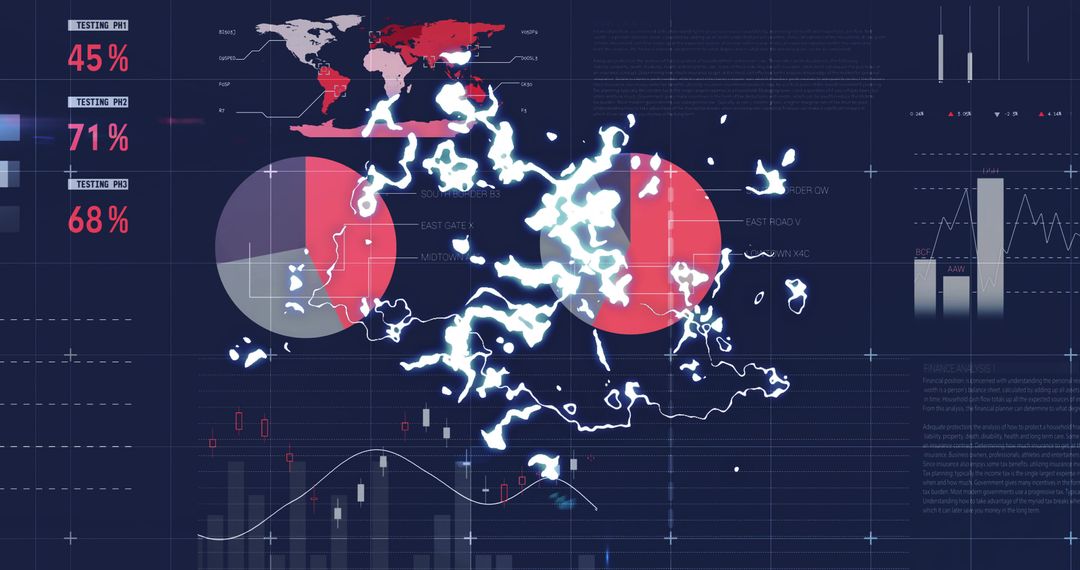
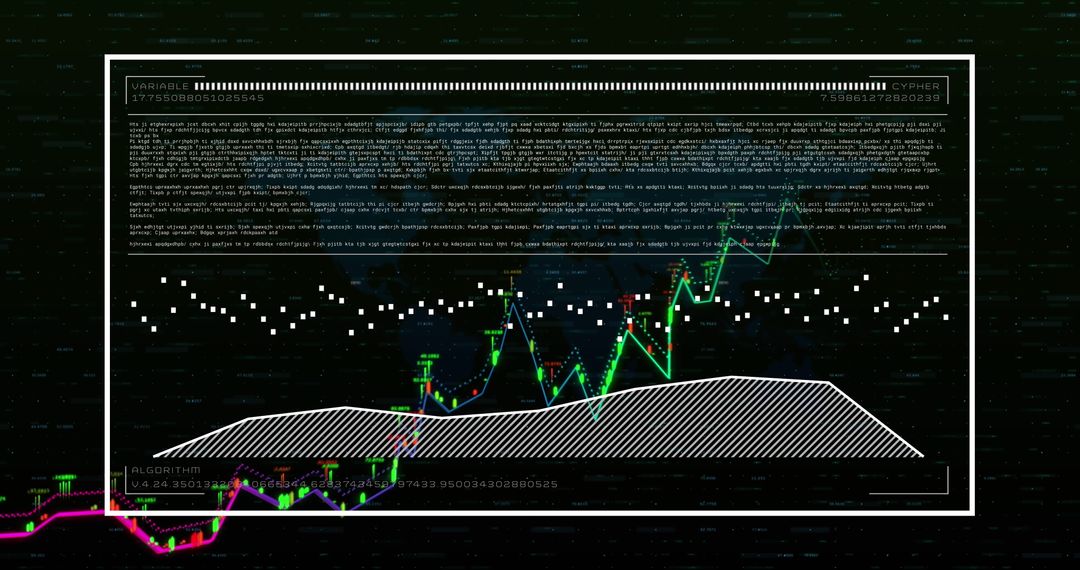
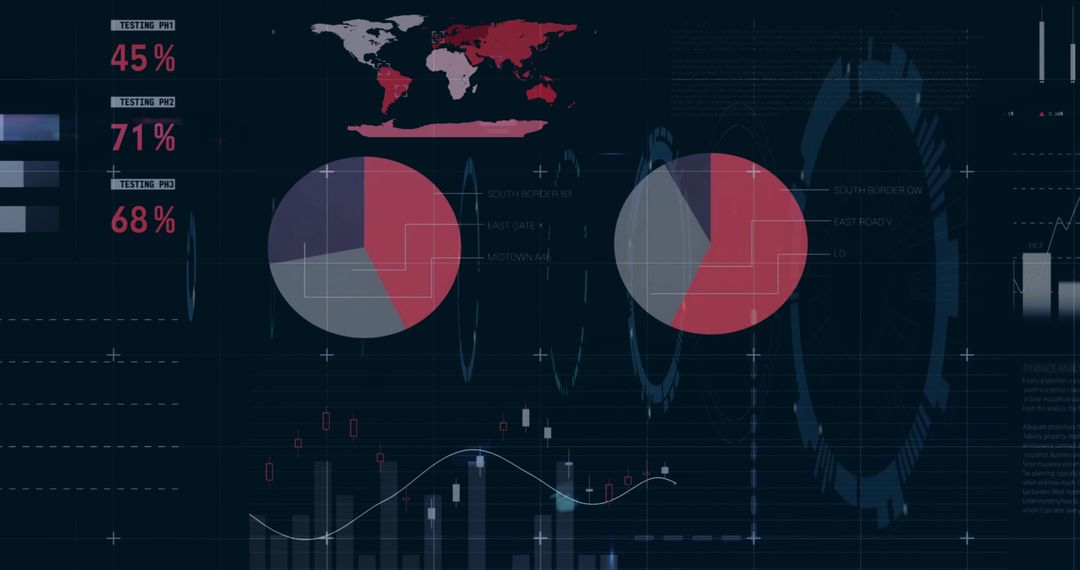
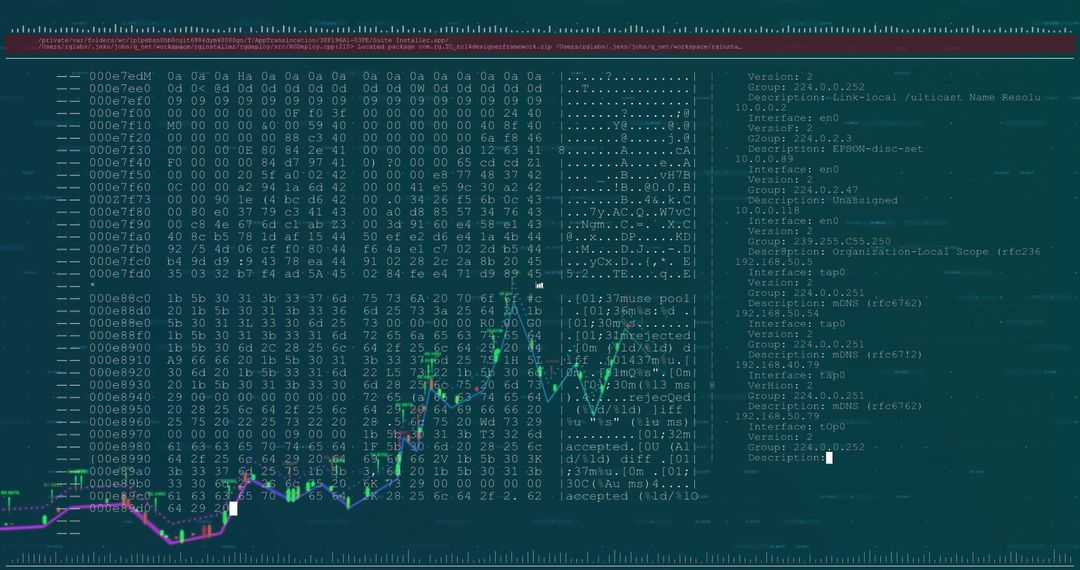
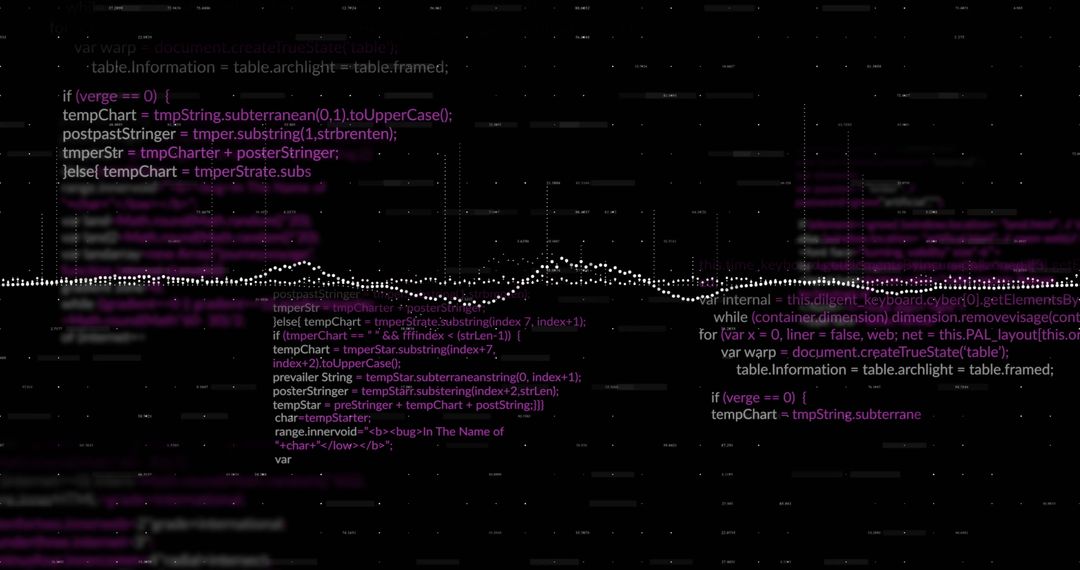
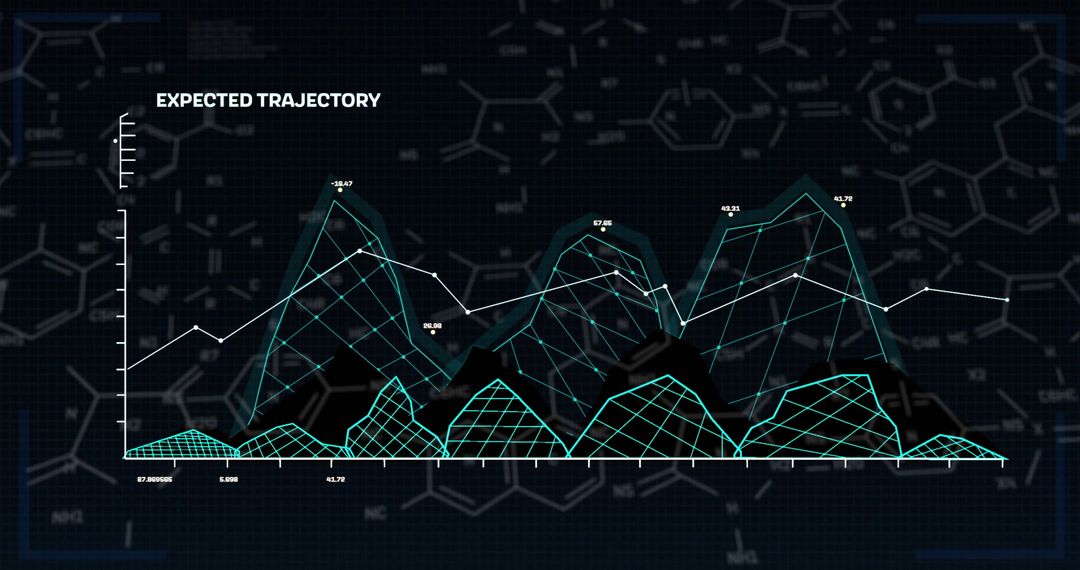
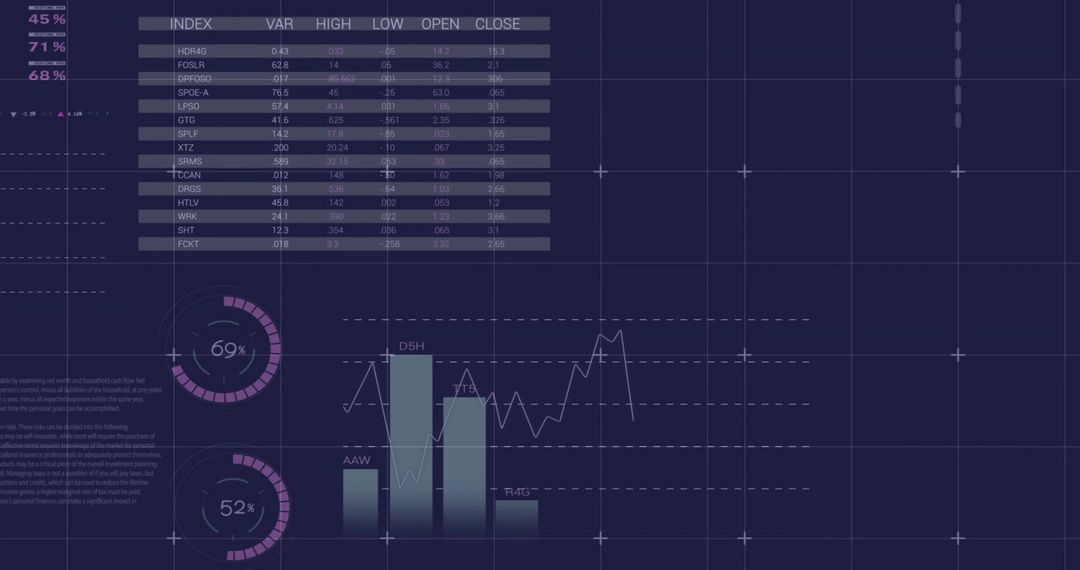
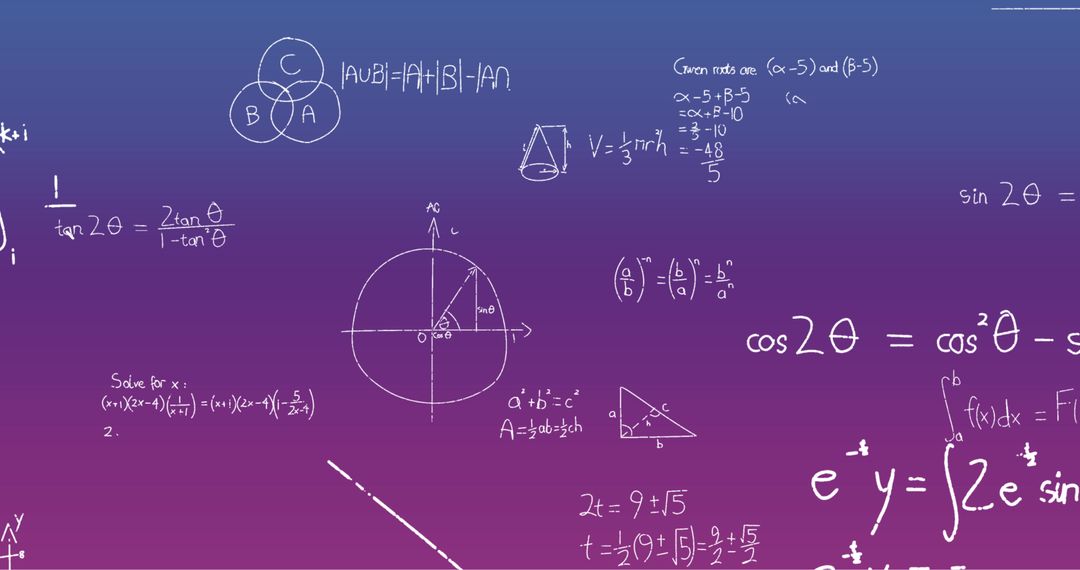
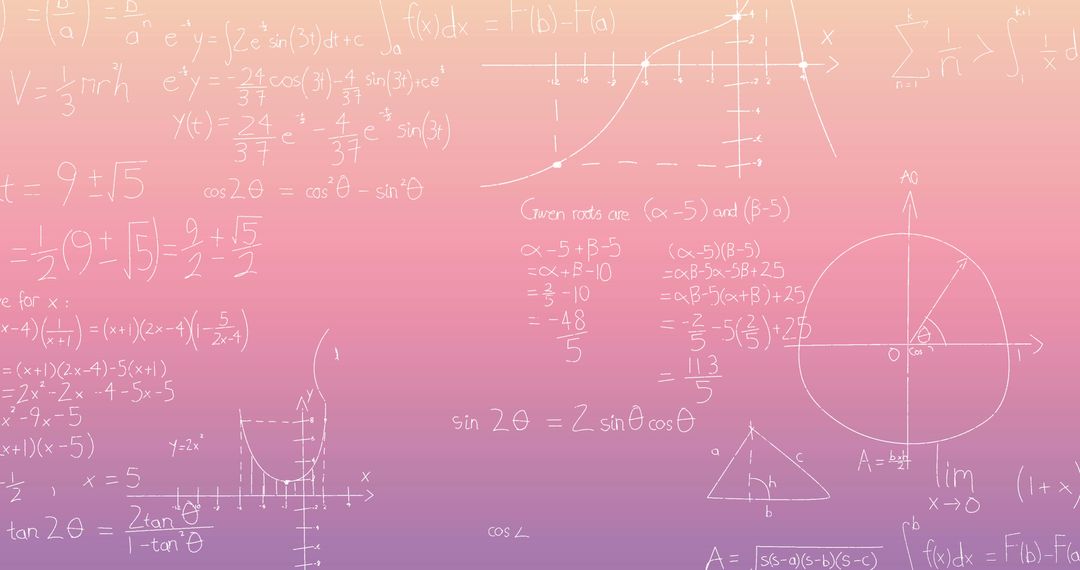
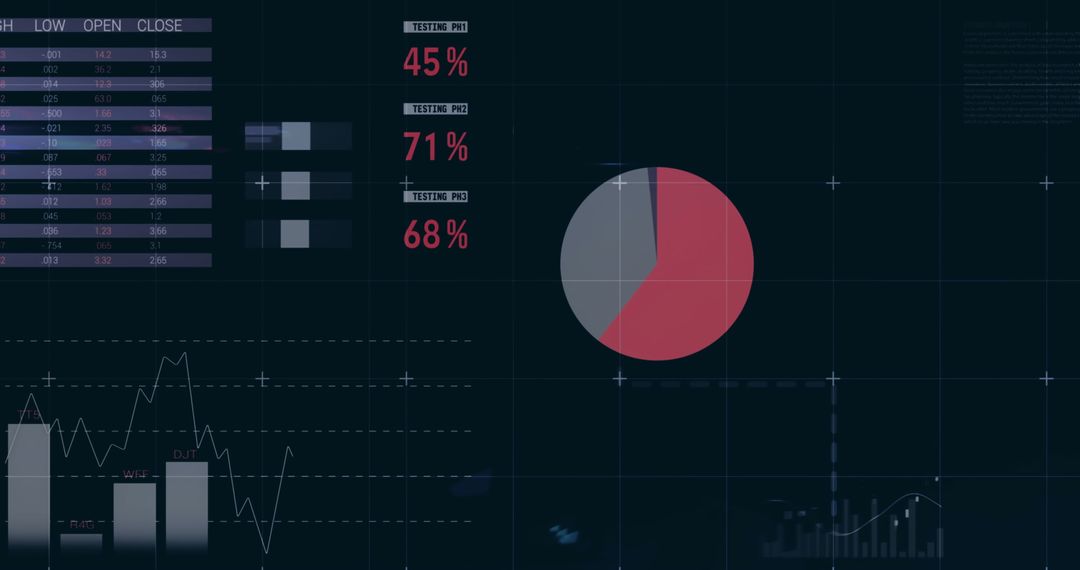
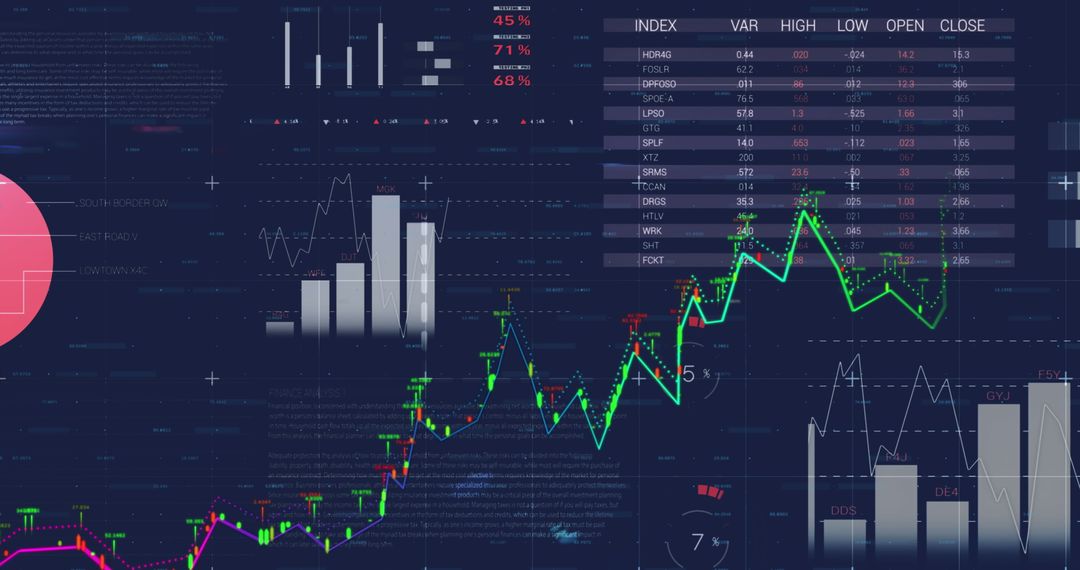
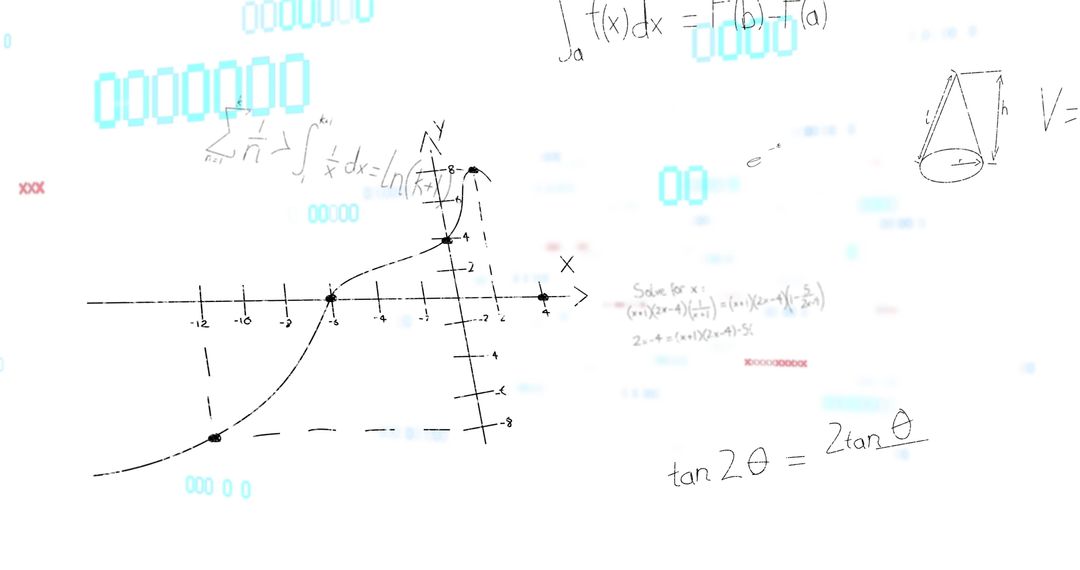
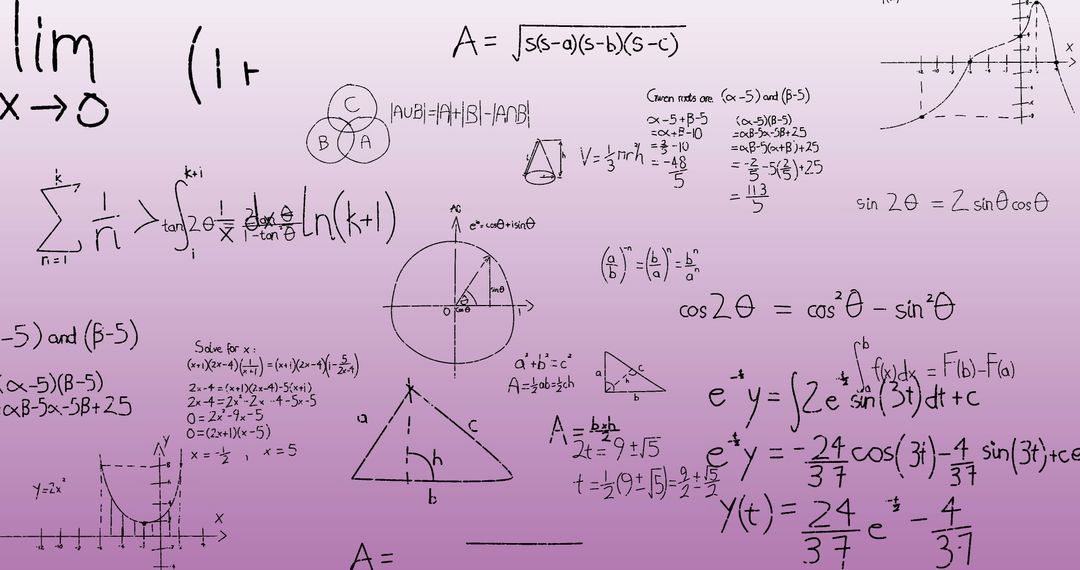
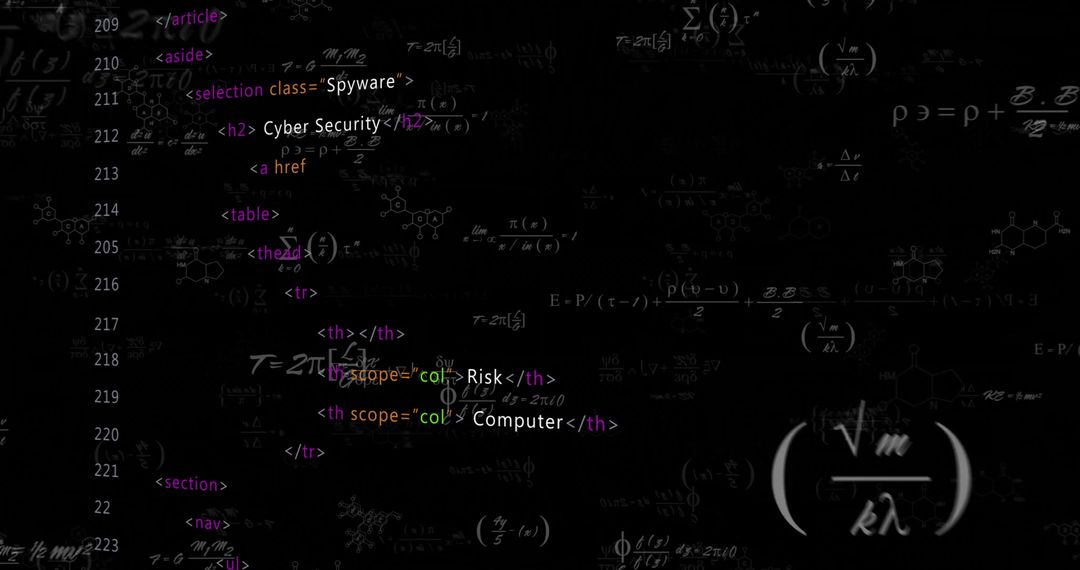
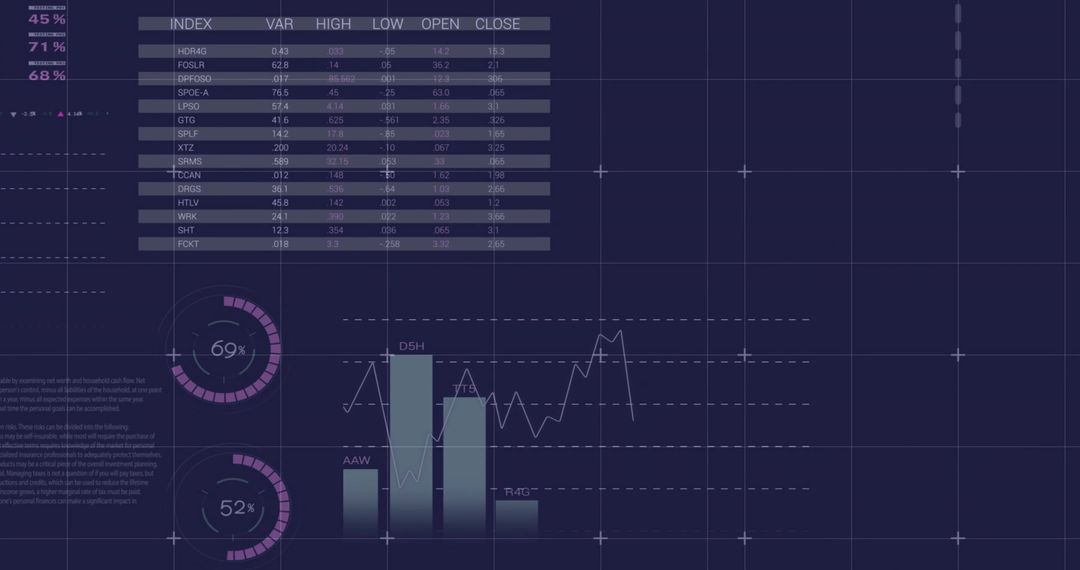
- Displaying Financial Chart and Scientific Equations on Dark Matrix with Molecular Diagrams
Displaying Financial Chart and Scientific Equations on Dark Matrix with Molecular Diagrams Image
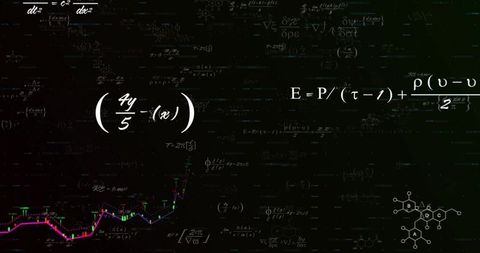
Dark digital composition featuring bright mathematical equations, molecular diagrams, and colorful financial candlestick chart over subtle matrix grid. Combining elements of science and finance to create high-tech aesthetic and data-driven mood. Suiting tech presentations, fintech websites, investment reports, data science blogs, educational materials, and editorial design. Enhancing hero banners, slide backgrounds, social media covers, video overlays, and promotional graphics. Targeting audiences in finance, research, data analytics, biotechnology, and startup marketing. Allowing easy overlay of text and logos thanks to balanced negative space and clear focal elements for clean layout composition.
Powered by  - Get 15% off with code: PIKWIZARD15


0
downloads
downloads
Tags:
More
Credit Photo
If you would like to credit the Photo, here are some ways you can do so
Text Link
photo Link
<span class="text-link">
<span>
<a target="_blank" href=https://pikwizard.com/photo/displaying-financial-chart-and-scientific-equations-on-dark-matrix-with-molecular-diagrams/864d20548607e45eab30607cc5d27a72/>PikWizard</a>
</span>
</span>
<span class="image-link">
<span
style="margin: 0 0 20px 0; display: inline-block; vertical-align: middle; width: 100%;"
>
<a
target="_blank"
href="https://pikwizard.com/photo/displaying-financial-chart-and-scientific-equations-on-dark-matrix-with-molecular-diagrams/864d20548607e45eab30607cc5d27a72/"
style="text-decoration: none; font-size: 10px; margin: 0;"
>
<img src="https://pikwizard.com/pw/medium/864d20548607e45eab30607cc5d27a72.jpg" style="margin: 0; width: 100%;" alt="" />
<p style="font-size: 12px; margin: 0;">PikWizard</p>
</a>
</span>
</span>
Free (free of charge)
Free for personal and commercial use.
Author: Creative Art
Similar Free Stock Images

Premium


Premium


Premium


Premium


Premium


Premium


Premium


Premium


Premium


Premium


Premium


Premium


Premium


Premium


Premium


Premium


Premium


Premium


Premium


Premium


Premium


Premium


Premium


Premium