- Home >
- Stock Photos >
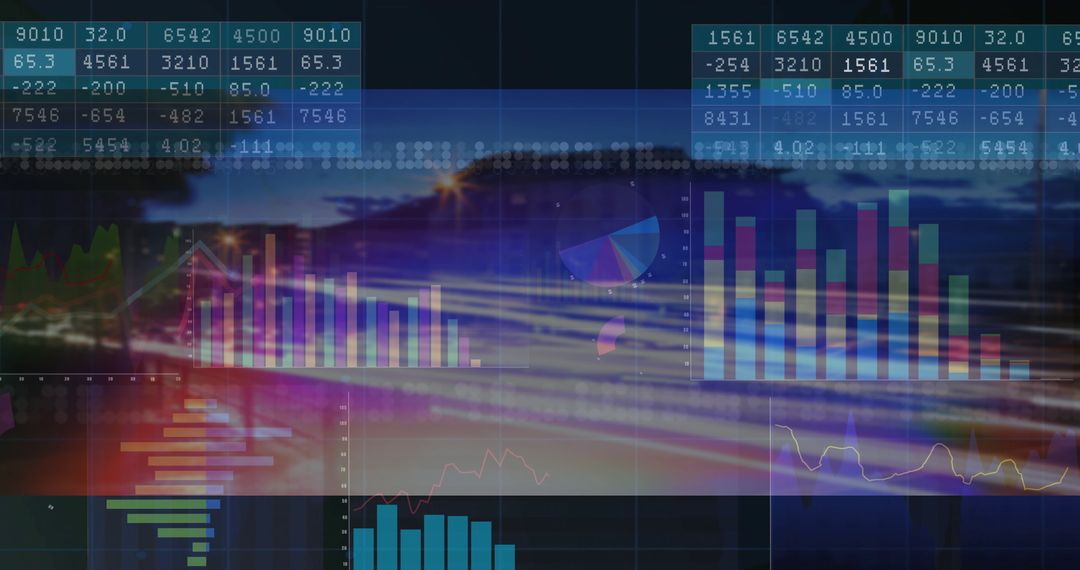
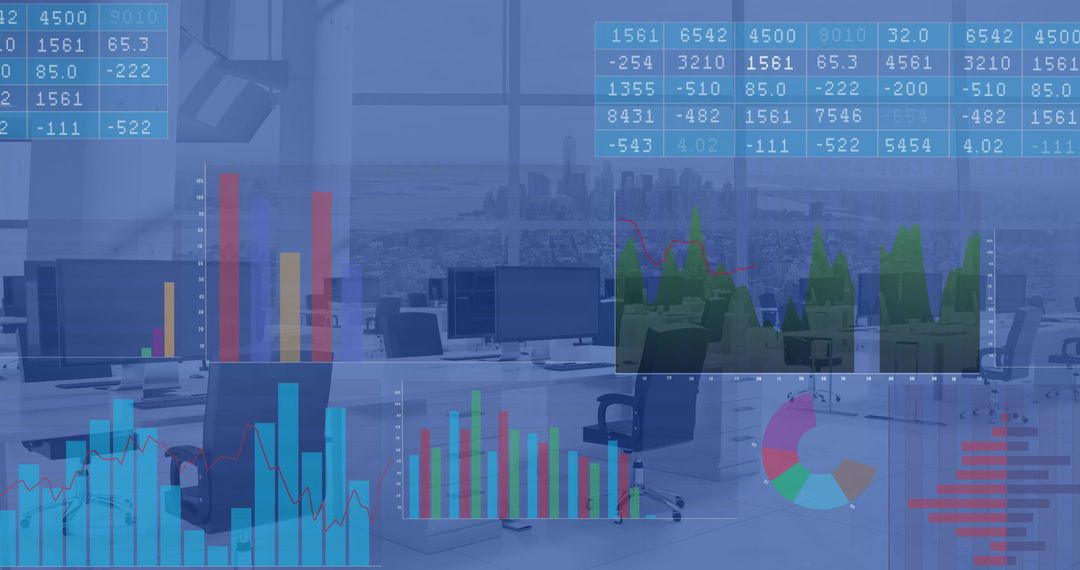
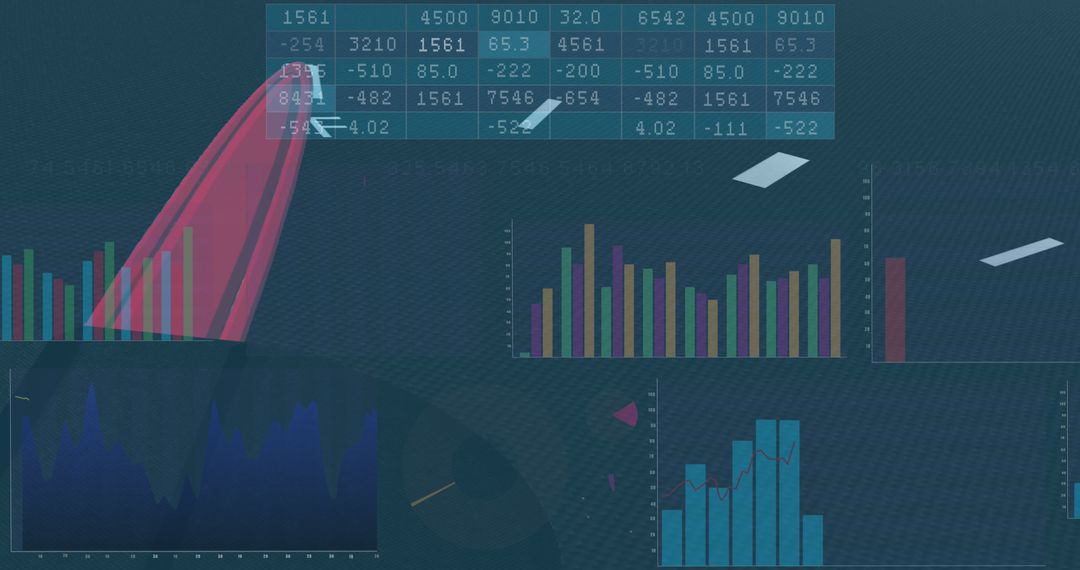
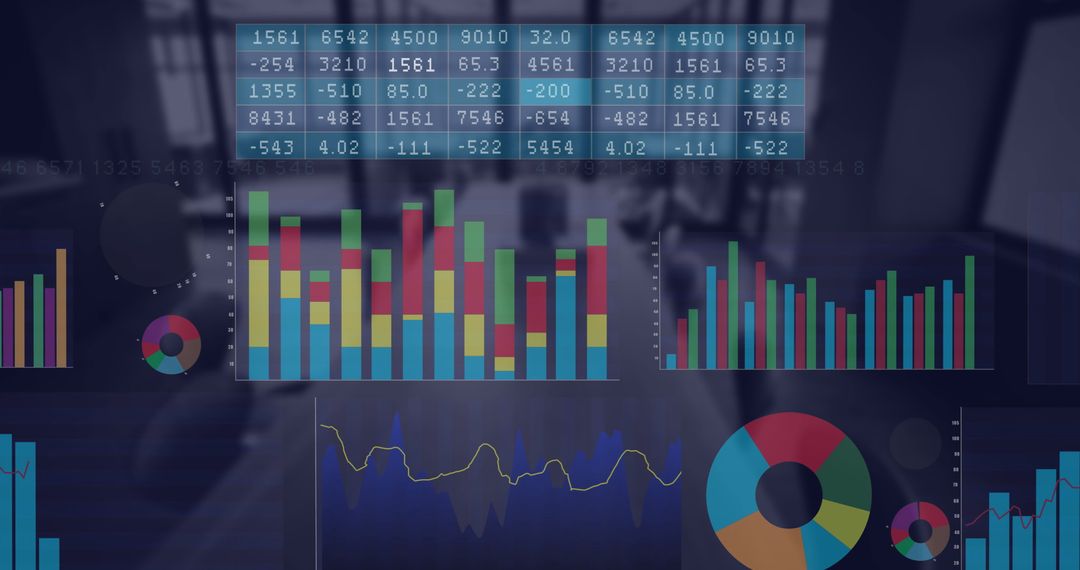
- Displaying financial charts overlaying modern office lounge with sofas and coffee table
Displaying financial charts overlaying modern office lounge with sofas and coffee table Image
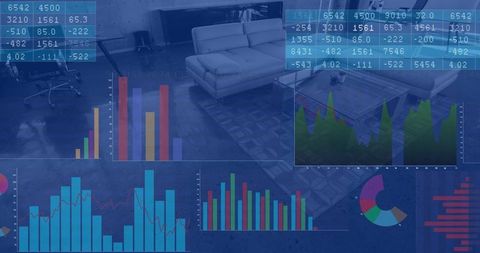
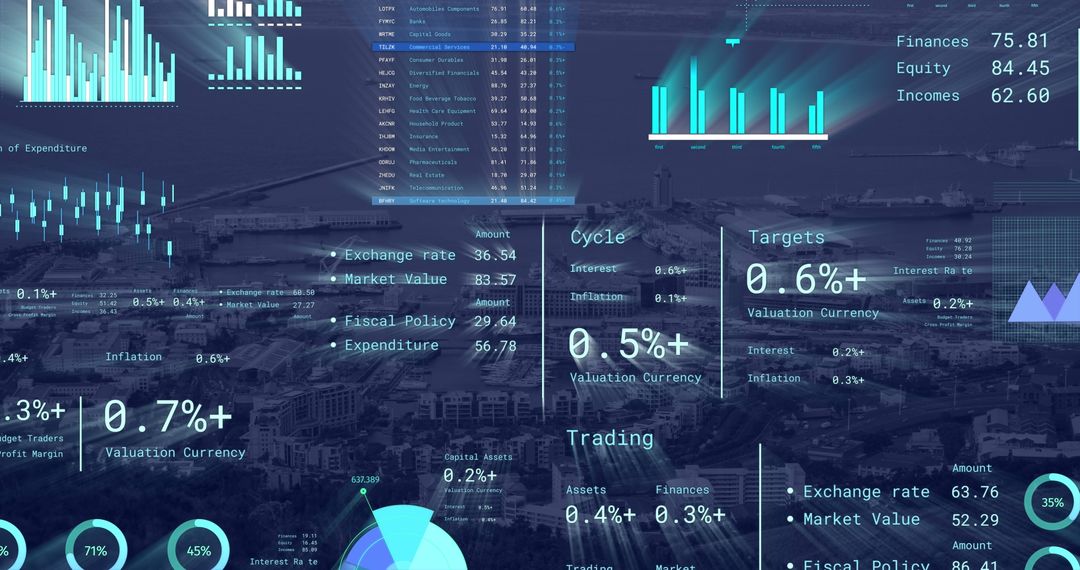
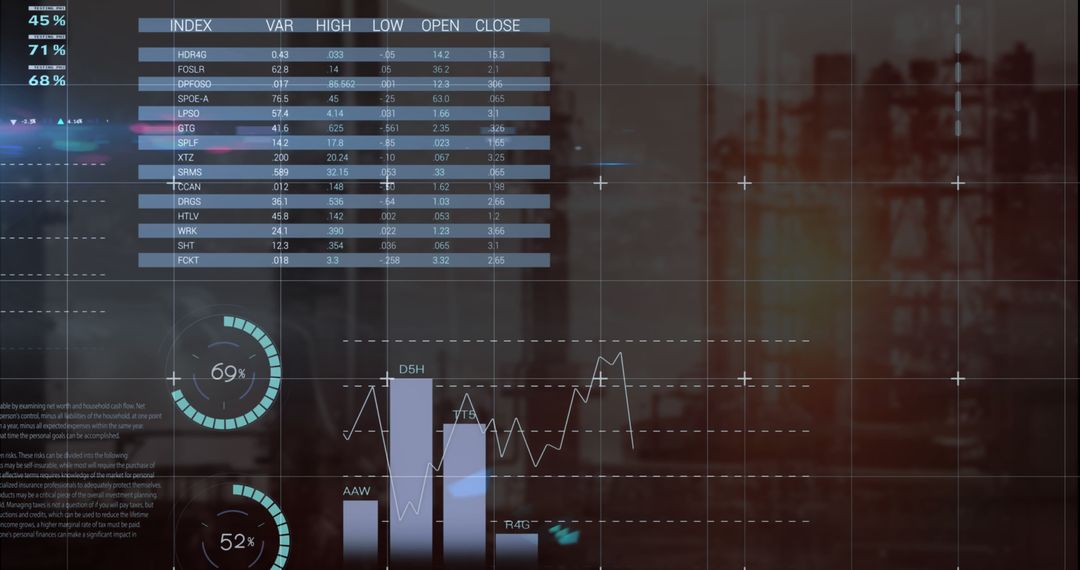
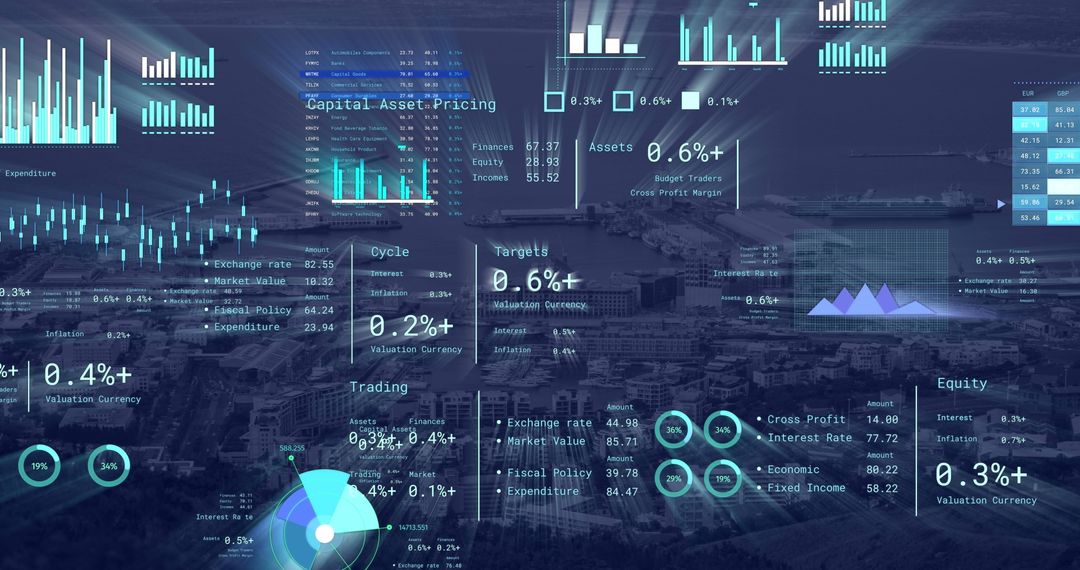
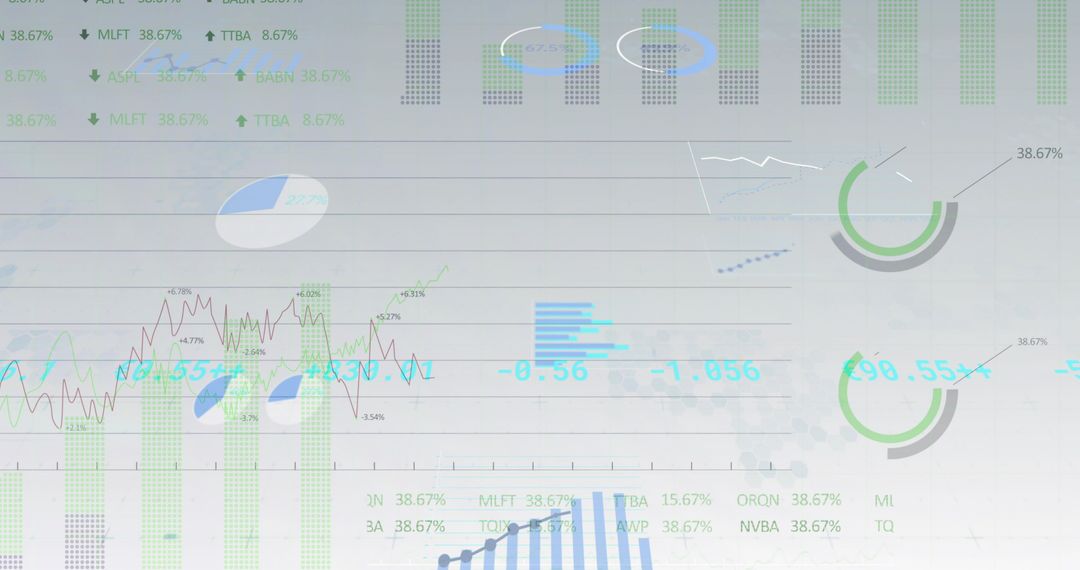
Composite scene showing financial charts and colorful graphs overlaid on modern office lounge with two sofas and glass coffee table. Blue-tinted data layers including bar charts, line graphs, area charts, pie chart, and numeric tables, creating tech-forward visual style. Serving ideal use for business presentations, fintech websites, annual reports, marketing materials, and coworking space branding. Serving as background for homepage hero, slide deck cover, blog header, or social media campaign promoting analytics, data strategy, or corporate interiors. File composition allowing cropping for banners, thumbnails, and print collateral. Color palette offering cool blues with accent reds and greens, suitable for modern corporate visual identity. Licensing note: Suitable for editorial and commercial use when following stock licensing terms.
Powered by 


0
downloads
downloads
Tags:
More
Credit Photo
If you would like to credit the Photo, here are some ways you can do so
Text Link
photo Link
<span class="text-link">
<span>
<a target="_blank" href=https://pikwizard.com/photo/displaying-financial-charts-overlaying-modern-office-lounge-with-sofas-and-coffee-table/9ee6a34ef5ea08536e39d5329b7e12b3/>PikWizard</a>
</span>
</span>
<span class="image-link">
<span
style="margin: 0 0 20px 0; display: inline-block; vertical-align: middle; width: 100%;"
>
<a
target="_blank"
href="https://pikwizard.com/photo/displaying-financial-charts-overlaying-modern-office-lounge-with-sofas-and-coffee-table/9ee6a34ef5ea08536e39d5329b7e12b3/"
style="text-decoration: none; font-size: 10px; margin: 0;"
>
<img src="https://pikwizard.com/pw/medium/9ee6a34ef5ea08536e39d5329b7e12b3.jpg" style="margin: 0; width: 100%;" alt="" />
<p style="font-size: 12px; margin: 0;">PikWizard</p>
</a>
</span>
</span>
Free (free of charge)
Free for personal and commercial use.
Author: Awesome Content
Similar Free Stock Images
Premium


Premium


Premium


Premium


Premium


Premium


Premium


Premium


Premium


Premium


Premium


Premium


Premium


Premium


Premium


Premium


Premium


Premium


Premium


Premium


Premium


Premium


Premium


Premium