- Home >
- Stock Photos >
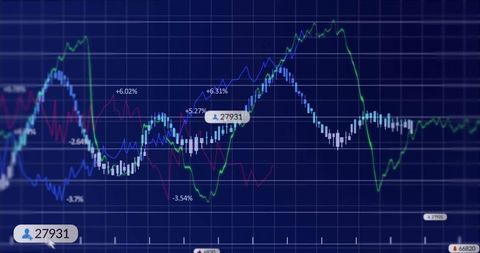
- Displaying Financial Dashboard with Candlestick Charts, Trend Lines and Economic Icons
Displaying Financial Dashboard with Candlestick Charts, Trend Lines and Economic Icons Image
Showing candlestick charts, layered trend lines, percentage labels, and industry icons representing energy, recycling, oil, and currency. Featuring blue grid background with blue, green, magenta lines and white candlestick bars for high-tech financial aesthetic. Helping illustrate market volatility, sector performance, ESG investing trends, and currency movements for editorial and marketing needs. Supporting use in website banners, investor presentations, financial reports, fintech app mockups, and social media posts. Allowing easy cropping for hero banners or thumbnails while preserving icon detail and chart legibility. Working well with overlay text, data callouts, and animated transitions for video or interactive dashboards.
Powered by  - Get 15% off with code: PIKWIZARD15


0
downloads
downloads
Tags:
More
Credit Photo
If you would like to credit the Photo, here are some ways you can do so
Text Link
photo Link
<span class="text-link">
<span>
<a target="_blank" href=https://pikwizard.com/photo/displaying-financial-dashboard-with-candlestick-charts-trend-lines-and-economic-icons/4156f990912f551c59a5552e79fdc6ec/>PikWizard</a>
</span>
</span>
<span class="image-link">
<span
style="margin: 0 0 20px 0; display: inline-block; vertical-align: middle; width: 100%;"
>
<a
target="_blank"
href="https://pikwizard.com/photo/displaying-financial-dashboard-with-candlestick-charts-trend-lines-and-economic-icons/4156f990912f551c59a5552e79fdc6ec/"
style="text-decoration: none; font-size: 10px; margin: 0;"
>
<img src="https://pikwizard.com/pw/medium/4156f990912f551c59a5552e79fdc6ec.jpg" style="margin: 0; width: 100%;" alt="" />
<p style="font-size: 12px; margin: 0;">PikWizard</p>
</a>
</span>
</span>
Free (free of charge)
Free for personal and commercial use.
Author: Authentic Images
Similar Free Stock Images
Loading...

Premium


Premium


Premium

Premium


Premium

Premium


Premium


Premium


Premium

Premium


Premium


Premium

Premium

Premium


Premium


Premium


Premium

Premium


Premium

Premium


Premium


Premium

Premium


Premium


Premium