- Home >
- Stock Photos >
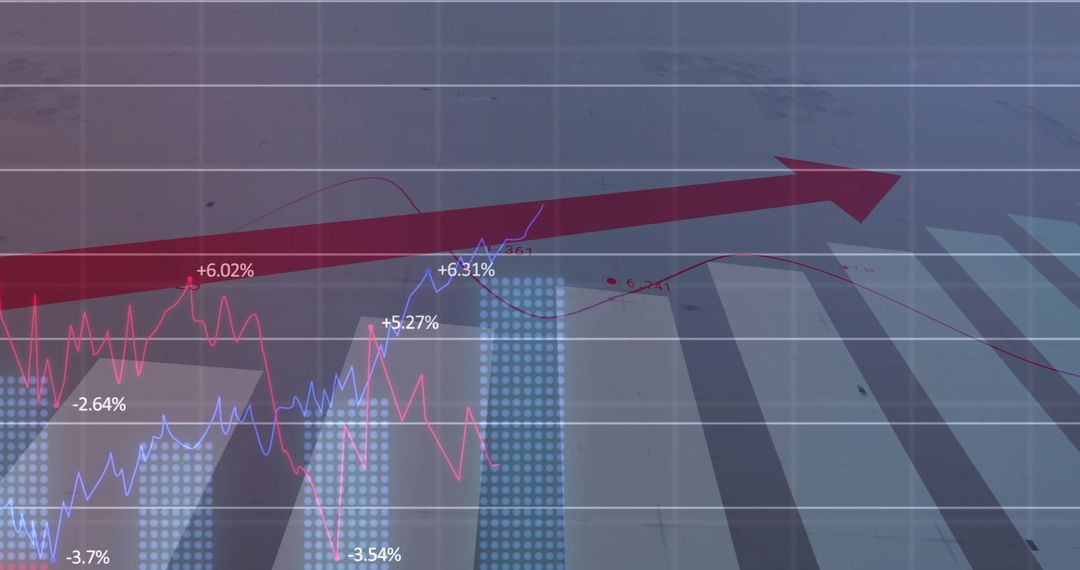
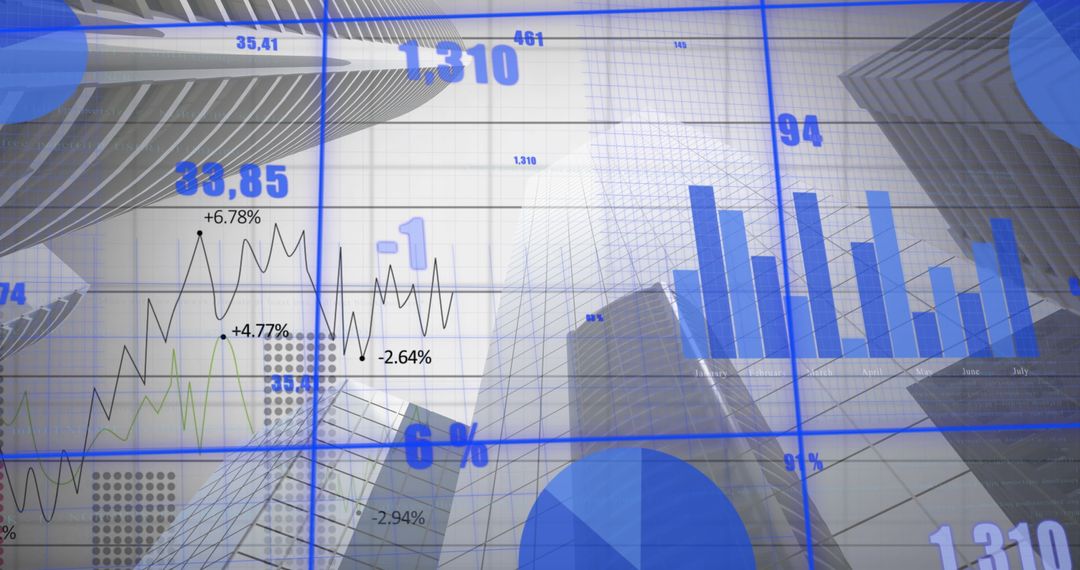
- Displaying financial growth dashboard with bold upward arrow, line charts, dotted bar analytics
Displaying financial growth dashboard with bold upward arrow, line charts, dotted bar analytics Image

Featuring high-tech layered dashboard with large red upward arrow crossing translucent grid, blue and red line graphs, dotted bar elements and percent labels. Perfect for investor reports, annual reports, pitch decks, news articles, blog posts, social media banners, website hero sections, presentation slides, training materials and marketing campaigns. Supporting messaging about market upturn, sales growth, KPI improvement, bullish trends and portfolio performance. Color palette offering strong red and blue contrast for urgent but clean look. Composition leaving open space on right for headline or overlay text. Easily crop-friendly for headers and banners and suitable for use in infographics, motion graphics and data-driven dashboards.
Powered by  - Get 15% off with code: PIKWIZARD15


0
downloads
downloads
Tags:
More
Credit Photo
If you would like to credit the Photo, here are some ways you can do so
Text Link
photo Link
<span class="text-link">
<span>
<a target="_blank" href=https://pikwizard.com/photo/displaying-financial-growth-dashboard-with-bold-upward-arrow-line-charts-dotted-bar-analytics/366e4098380055e571ac7de099b8f86e/>PikWizard</a>
</span>
</span>
<span class="image-link">
<span
style="margin: 0 0 20px 0; display: inline-block; vertical-align: middle; width: 100%;"
>
<a
target="_blank"
href="https://pikwizard.com/photo/displaying-financial-growth-dashboard-with-bold-upward-arrow-line-charts-dotted-bar-analytics/366e4098380055e571ac7de099b8f86e/"
style="text-decoration: none; font-size: 10px; margin: 0;"
>
<img src="https://pikwizard.com/pw/medium/366e4098380055e571ac7de099b8f86e.jpg" style="margin: 0; width: 100%;" alt="" />
<p style="font-size: 12px; margin: 0;">PikWizard</p>
</a>
</span>
</span>
Free (free of charge)
Free for personal and commercial use.
Author: Awesome Content
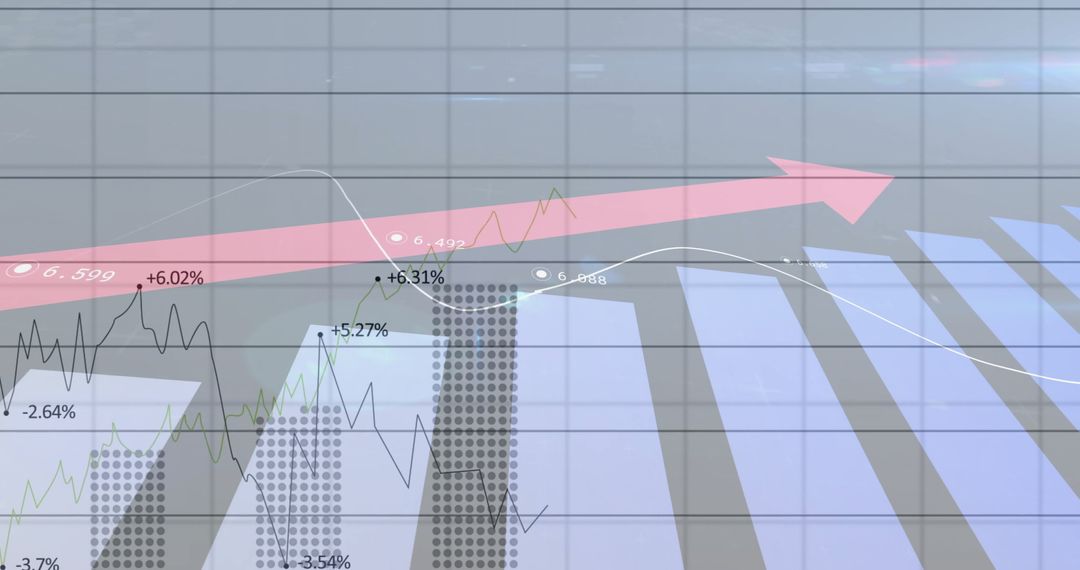
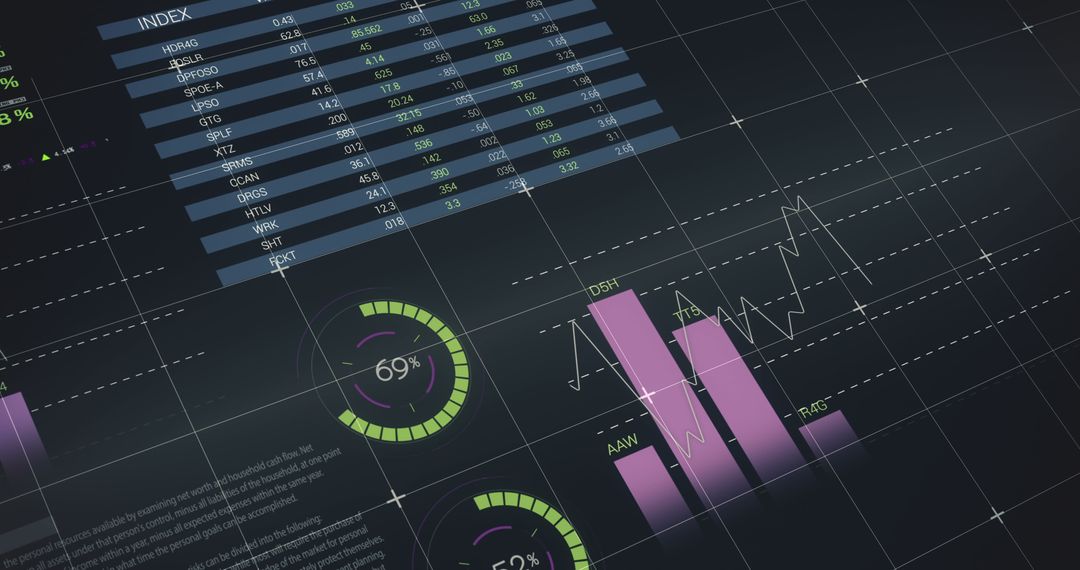
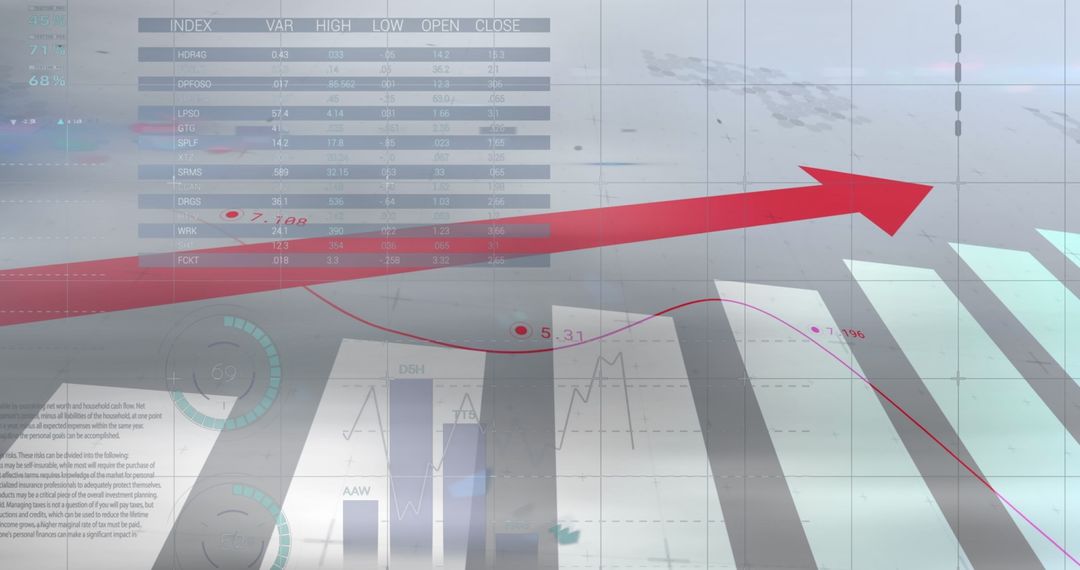
Similar Free Stock Images

Premium


Premium


Premium


Premium


Premium


Premium


Premium


Premium


Premium


Premium


Premium


Premium


Premium


Premium


Premium


Premium


Premium


Premium


Premium


Premium


Premium


Premium


Premium


Premium