- Home >
- Stock Photos >
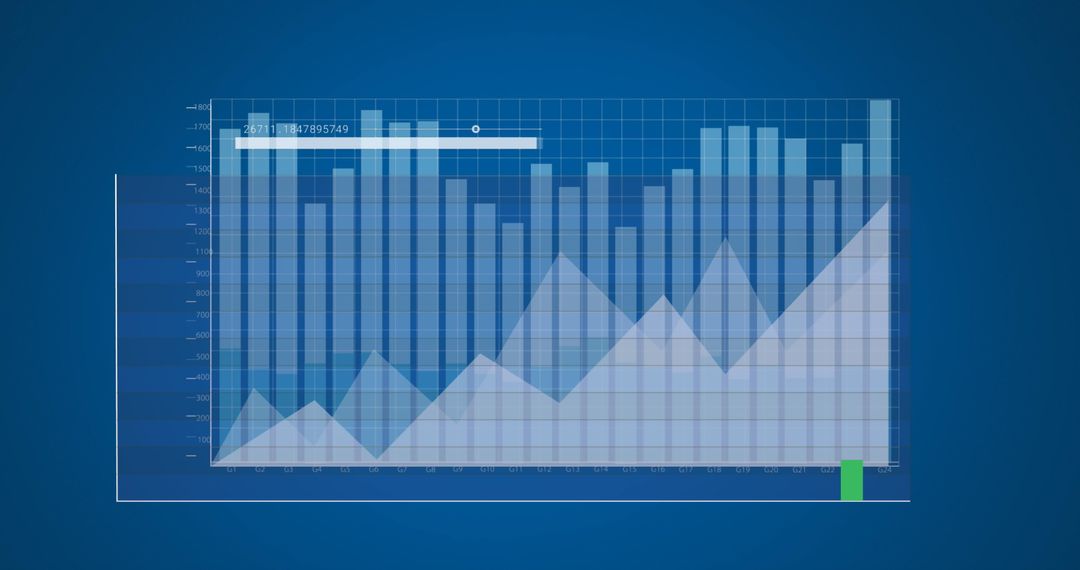
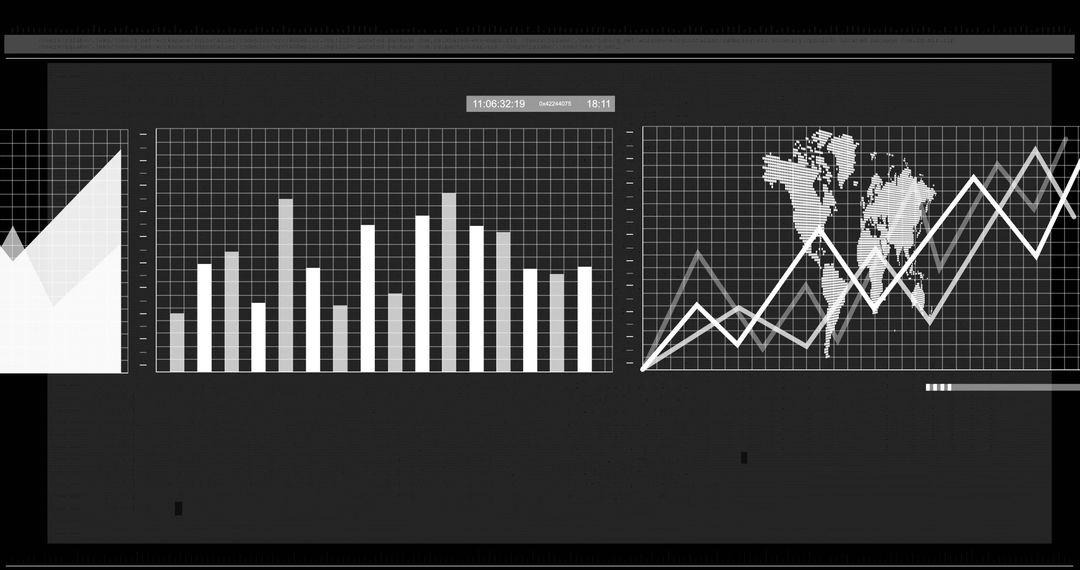
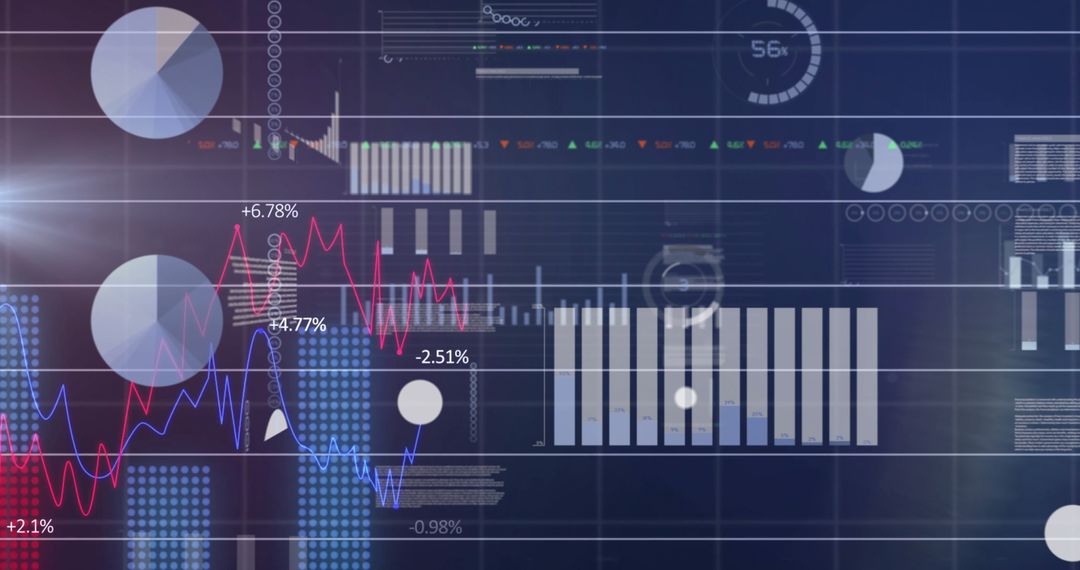
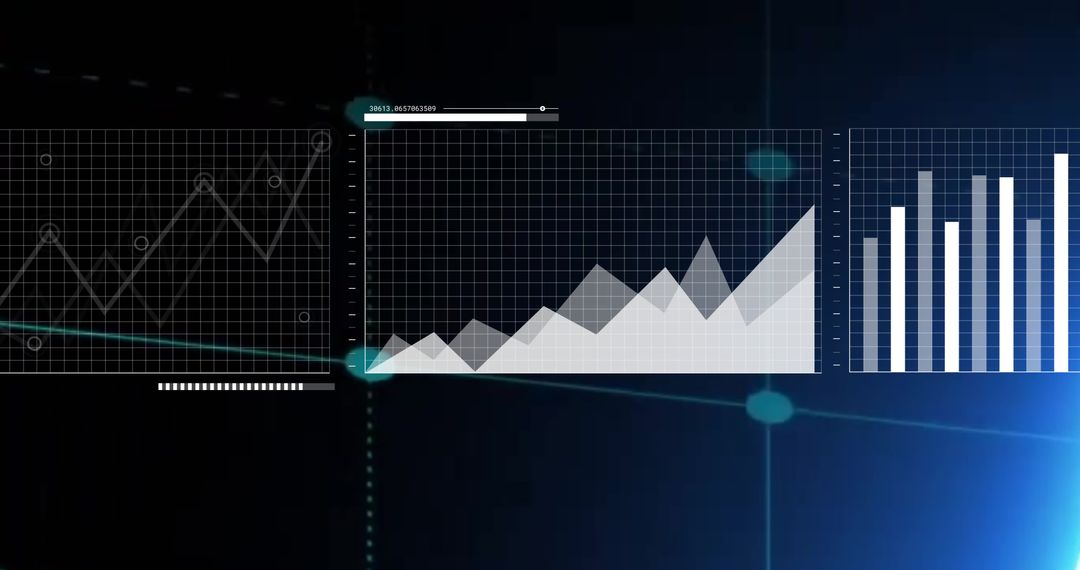
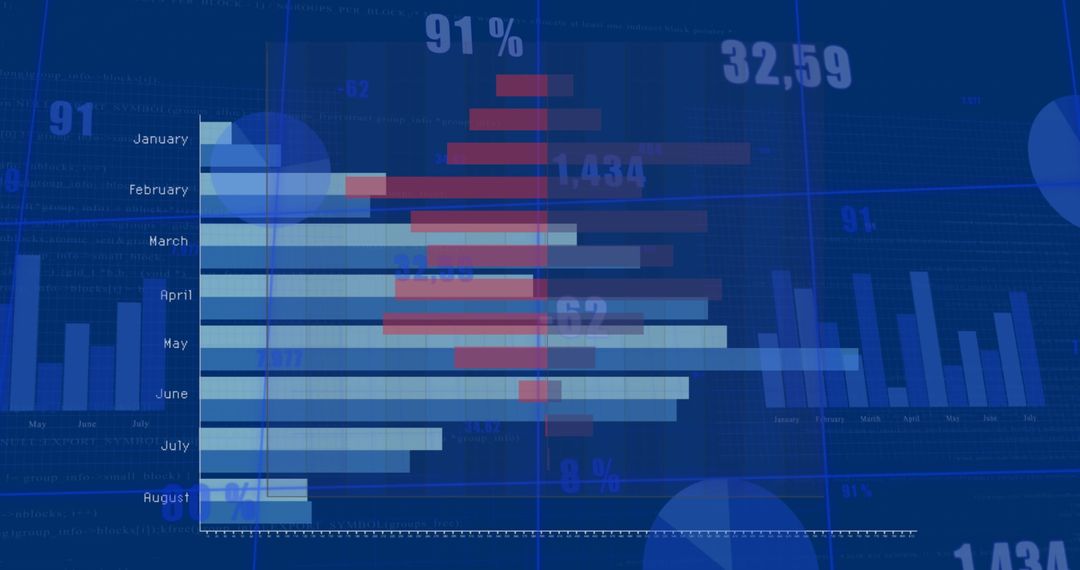
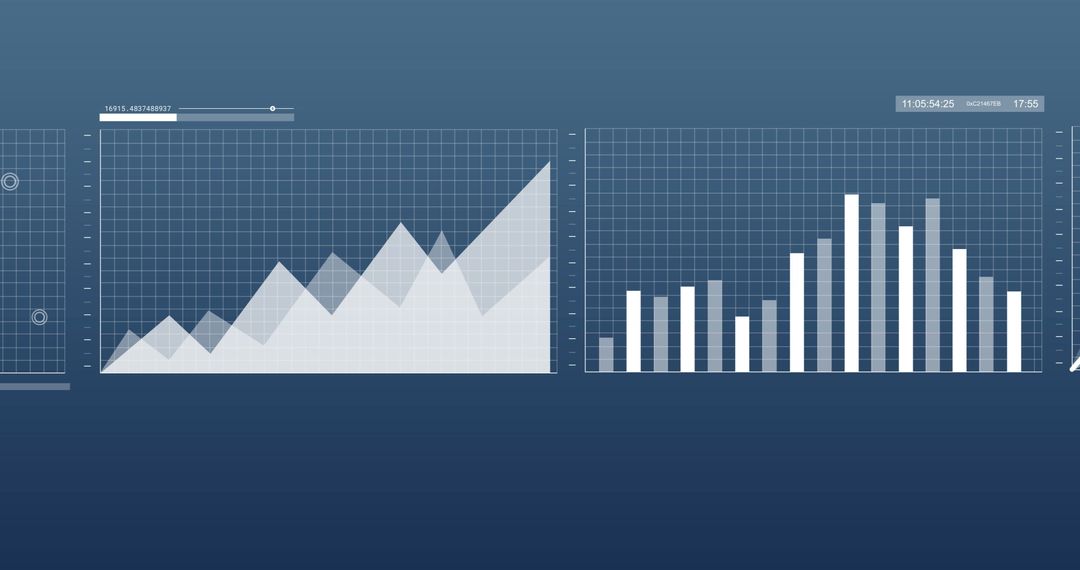
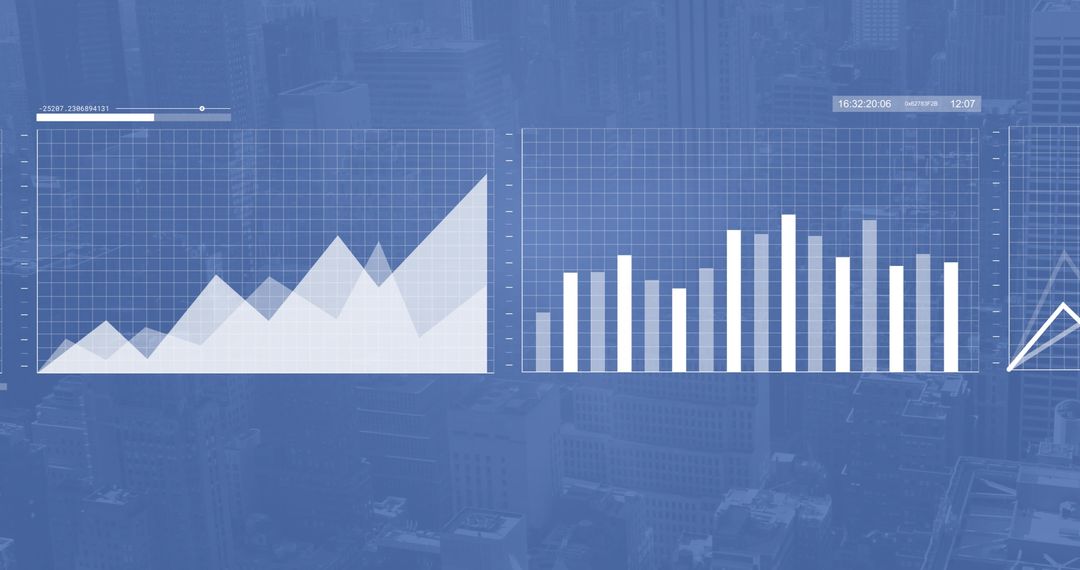
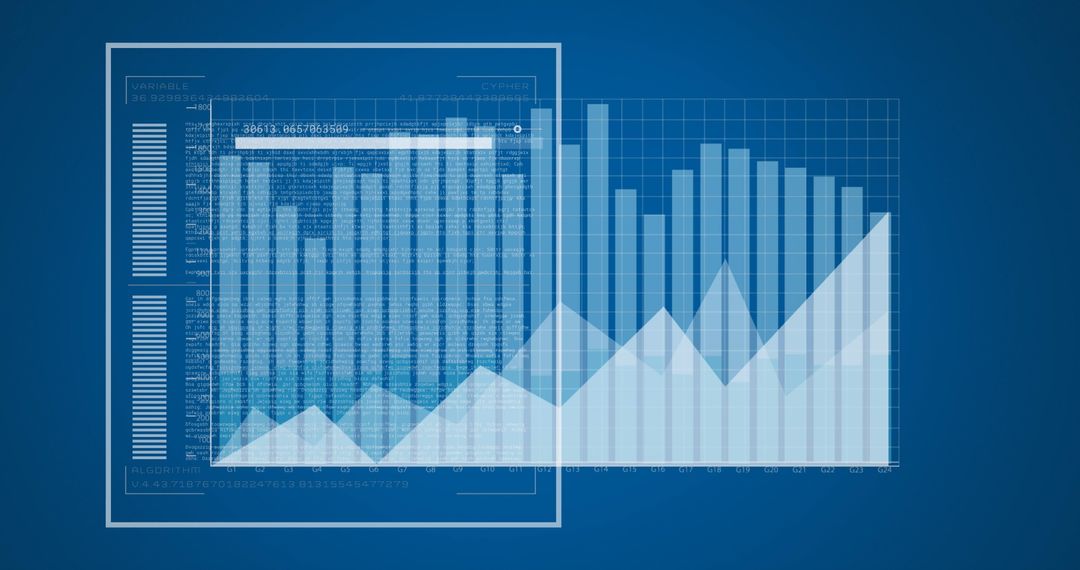
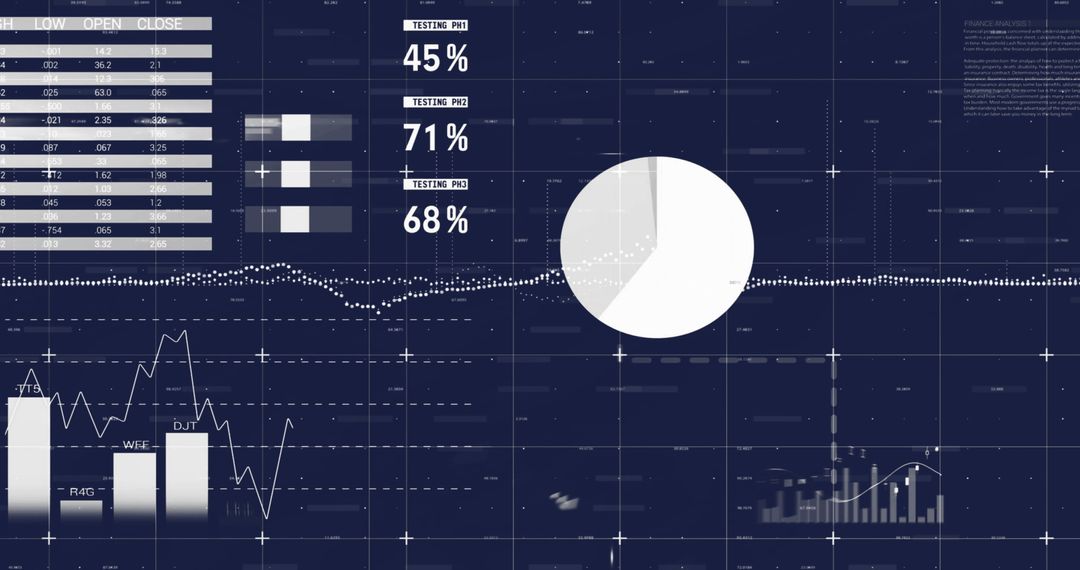
- Displaying futuristic analytics dashboard with dual charts, neon blue HUD metrics
Displaying futuristic analytics dashboard with dual charts, neon blue HUD metrics Image

Scene showing dual-panel analytics dashboard on deep blue grid background, featuring layered area peaks and clustered bar chart with percentage labels and HUD overlays. Neon cyan accents and subtle glow creating futuristic technology mood suitable for finance, data science, and tech content. Composition leaving negative space for headline, logo, or overlay text. Working well for business presentations, investor pitch decks, fintech websites, marketing banners, data reports, and UI mockups. Allowing easy color adjustments, text placement, and cropping for editorial and promotional layouts.
Powered by  - Get 15% off with code: PIKWIZARD15


0
downloads
downloads
Tags:
More
Credit Photo
If you would like to credit the Photo, here are some ways you can do so
Text Link
photo Link
<span class="text-link">
<span>
<a target="_blank" href=https://pikwizard.com/photo/displaying-futuristic-analytics-dashboard-with-dual-charts-neon-blue-hud-metrics/eb0133ff7f4be1673fb82bc9bedeca94/>PikWizard</a>
</span>
</span>
<span class="image-link">
<span
style="margin: 0 0 20px 0; display: inline-block; vertical-align: middle; width: 100%;"
>
<a
target="_blank"
href="https://pikwizard.com/photo/displaying-futuristic-analytics-dashboard-with-dual-charts-neon-blue-hud-metrics/eb0133ff7f4be1673fb82bc9bedeca94/"
style="text-decoration: none; font-size: 10px; margin: 0;"
>
<img src="https://pikwizard.com/pw/medium/eb0133ff7f4be1673fb82bc9bedeca94.jpg" style="margin: 0; width: 100%;" alt="" />
<p style="font-size: 12px; margin: 0;">PikWizard</p>
</a>
</span>
</span>
Free (free of charge)
Free for personal and commercial use.
Author: Awesome Content
Similar Free Stock Images
Premium


Premium


Premium


Premium


Premium


Premium


Premium


Premium


Premium


Premium


Premium


Premium


Premium


Premium


Premium


Premium


Premium


Premium


Premium


Premium


Premium


Premium


Premium


Premium