
- Home >
- Free Stock Photos & Images >
- Displaying futuristic financial line chart with perspective grid and analytics panel
Displaying futuristic financial line chart with perspective grid and analytics panel Free Stock Image

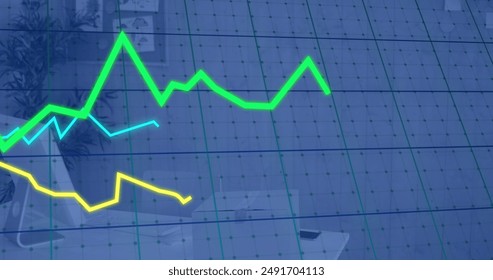
Presenting dark futuristic dashboard with perspective grid, zigzag trend line, and circular node markers. Working well for fintech websites, investor pitch decks, business intelligence reports, marketing banners, presentation slides. Supporting overlay of logos, headlines, data callouts thanks to left analytics column and open grid space. Enhancing UI mockups, motion graphics, and web hero panels with animated line transitions. Providing high-contrast visual for illustrating growth, volatility, forecasting, and big data analytics. Recommending editable color overlays and typography pairing to match brand identity. Optimizing for both digital and print usage; exporting as high-resolution background or layered asset for animation.
Powered by  - Get 15% off with code: PIKWIZARD15


downloads
Tags:
More
Credit Photo
If you would like to credit the Photo, here are some ways you can do so
Text Link
photo Link
<span class="text-link">
<span>
<a target="_blank" href=https://pikwizard.com/photo/displaying-futuristic-financial-line-chart-with-perspective-grid-and-analytics-panel/c80f47f787b47b6162b07d8f28d07cbf/>PikWizard</a>
</span>
</span>
<span class="image-link">
<span
style="margin: 0 0 20px 0; display: inline-block; vertical-align: middle; width: 100%;"
>
<a
target="_blank"
href="https://pikwizard.com/photo/displaying-futuristic-financial-line-chart-with-perspective-grid-and-analytics-panel/c80f47f787b47b6162b07d8f28d07cbf/"
style="text-decoration: none; font-size: 10px; margin: 0;"
>
<img src="https://thumbs.wbm.im/pw/medium/c80f47f787b47b6162b07d8f28d07cbf.jpg" style="margin: 0; width: 100%;" alt="Displaying futuristic financial line chart with perspective grid and analytics panel" />
<p style="font-size: 12px; margin: 0;">PikWizard</p>
</a>
</span>
</span>
Free (free of charge)
Free for personal and commercial use.
Author: People Creations
Similar Free Stock Images


Premium


Premium


Premium


Premium


Premium


Premium


Premium


Premium


Premium


Premium


Premium


Premium


Premium


Premium


Premium


Premium


Premium


Premium


Premium


Premium


Premium


Premium


Premium


Premium


Premium

Explore More Free Stock Images