
- Home >
- Stock Photos >
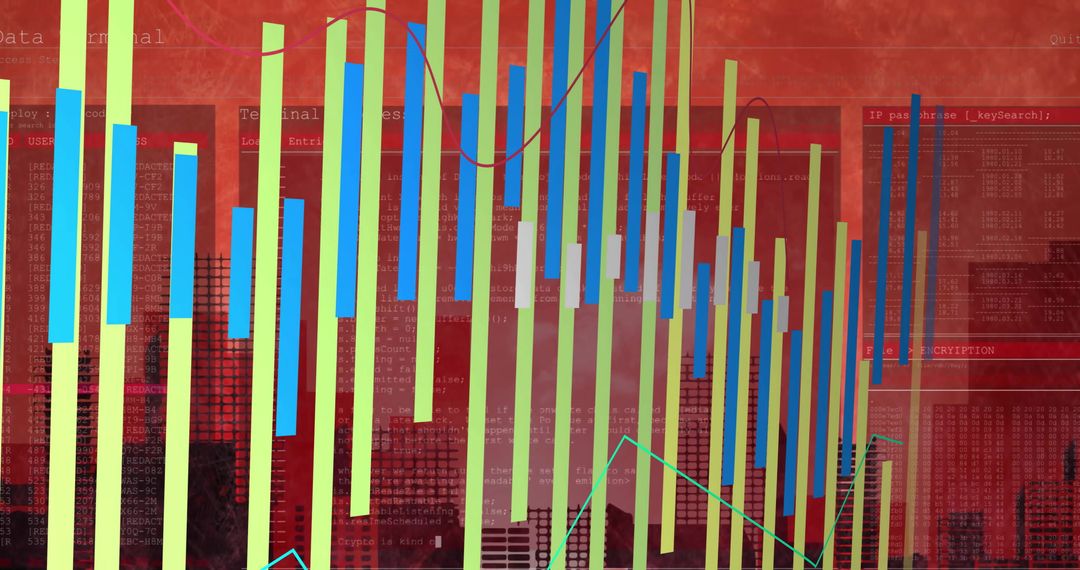
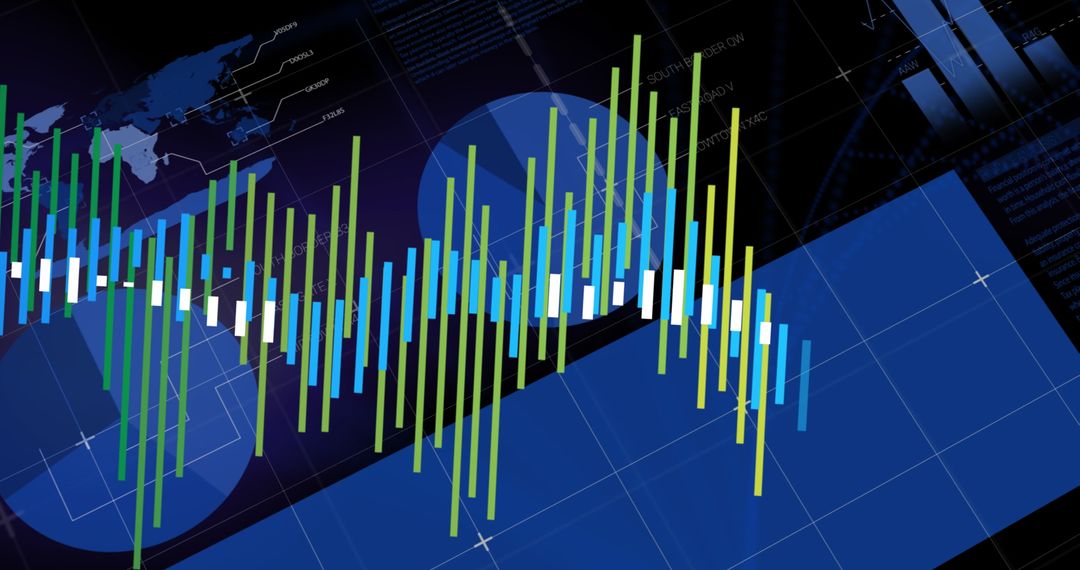
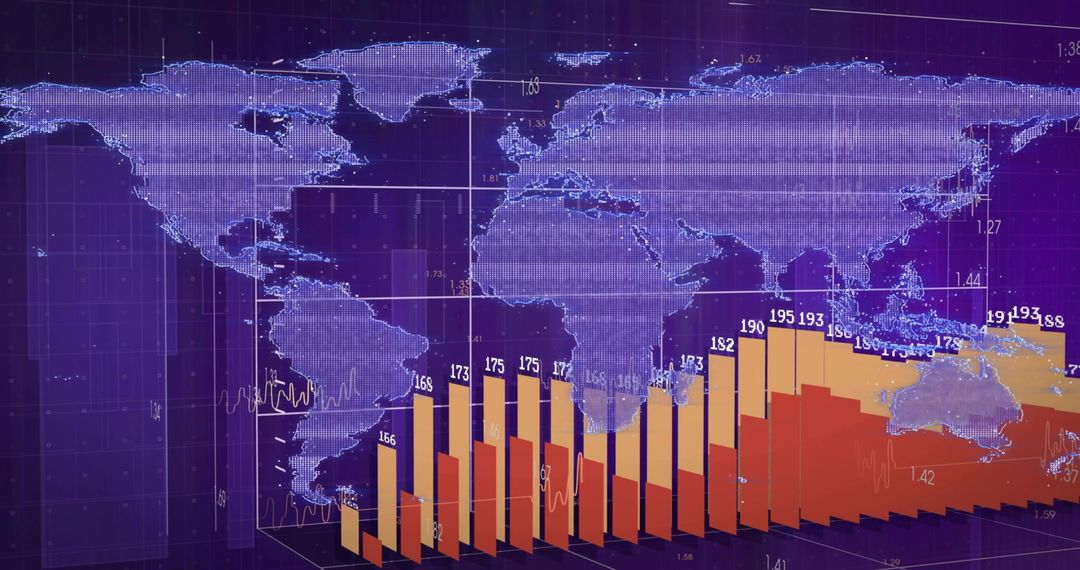
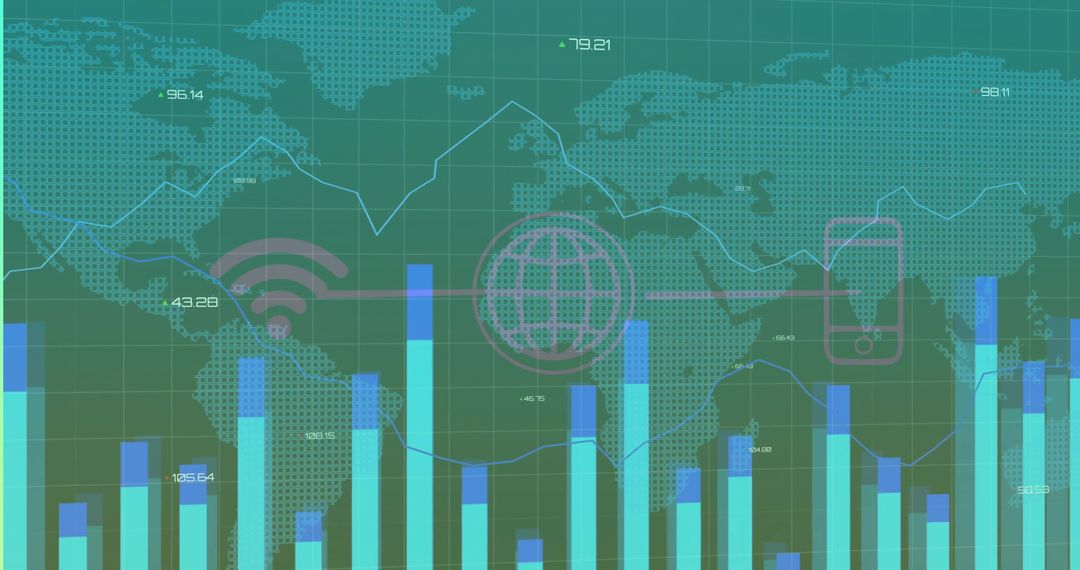
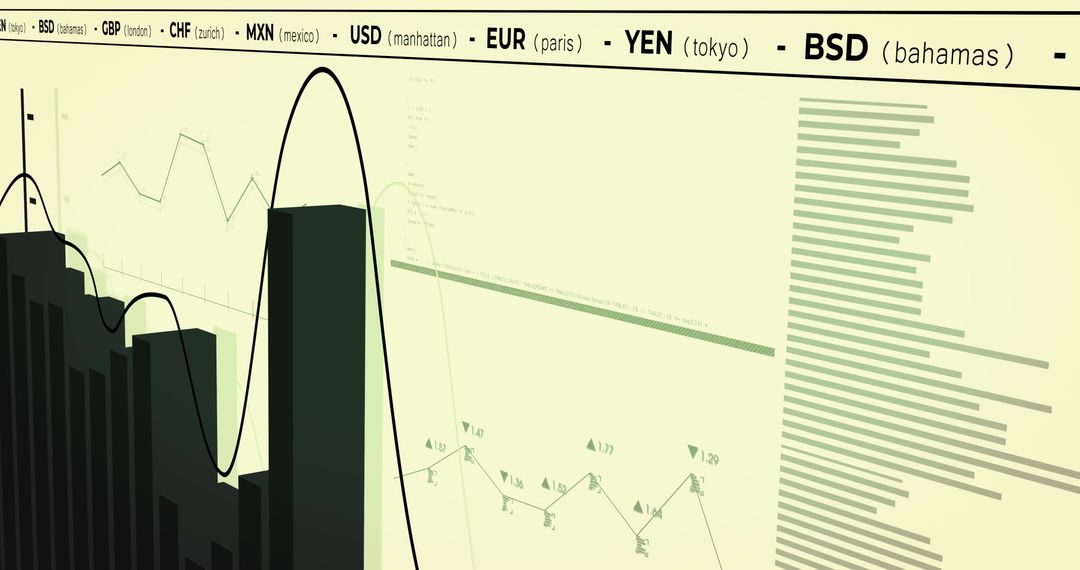
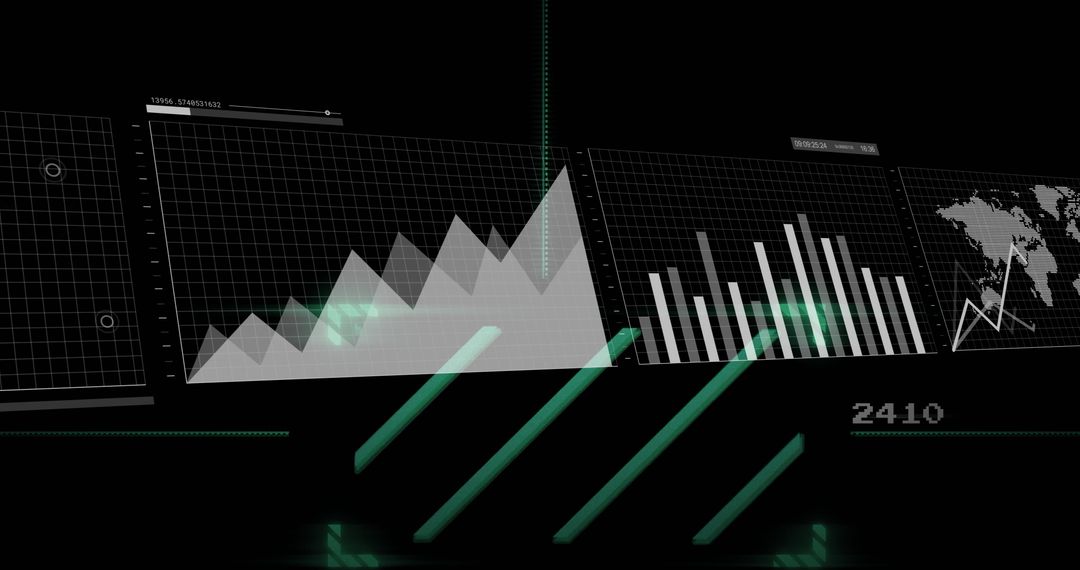
- Displaying futuristic magenta data dashboard with area, bar and line charts over world map
Displaying futuristic magenta data dashboard with area, bar and line charts over world map Image

Showing three translucent dashboard panels with area, bar and line charts layered over world map and neon magenta code background. Featuring high-contrast color palette and grid overlays that highlight data patterns and global trends. Ideal for technology, finance, data science, market research and marketing projects. Serving as hero art for website headers, presentation slides, pitch decks, social media posts and editorial layouts about analytics and global markets. Suggesting crop for banner formats, adding bold headline in left margin, and placing logo in top-right corner for brand integration. Recommending animating chart elements for video intros, explainer clips or motion graphics to increase engagement.
Powered by 


0
downloads
downloads
Tags:
More
Credit Photo
If you would like to credit the Photo, here are some ways you can do so
Text Link
photo Link
<span class="text-link">
<span>
<a target="_blank" href=https://pikwizard.com/photo/displaying-futuristic-magenta-data-dashboard-with-area-bar-and-line-charts-over-world-map/505085d3a3cd44e1abcd582f3170ef84/>PikWizard</a>
</span>
</span>
<span class="image-link">
<span
style="margin: 0 0 20px 0; display: inline-block; vertical-align: middle; width: 100%;"
>
<a
target="_blank"
href="https://pikwizard.com/photo/displaying-futuristic-magenta-data-dashboard-with-area-bar-and-line-charts-over-world-map/505085d3a3cd44e1abcd582f3170ef84/"
style="text-decoration: none; font-size: 10px; margin: 0;"
>
<img src="https://pikwizard.com/pw/medium/505085d3a3cd44e1abcd582f3170ef84.jpg" style="margin: 0; width: 100%;" alt="" />
<p style="font-size: 12px; margin: 0;">PikWizard</p>
</a>
</span>
</span>
Free (free of charge)
Free for personal and commercial use.
Author: Authentic Images
Similar Free Stock Images

Premium


Premium


Premium


Premium


Premium


Premium


Premium


Premium


Premium


Premium


Premium


Premium


Premium


Premium


Premium


Premium


Premium


Premium


Premium


Premium


Premium


Premium


Premium


Premium

