
- Home >
- Free Stock Photos & Images >
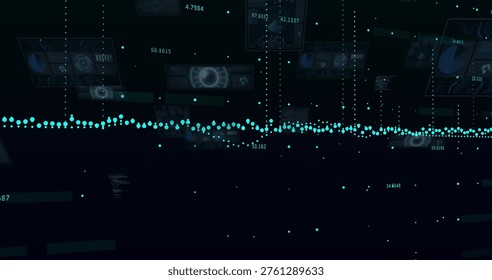
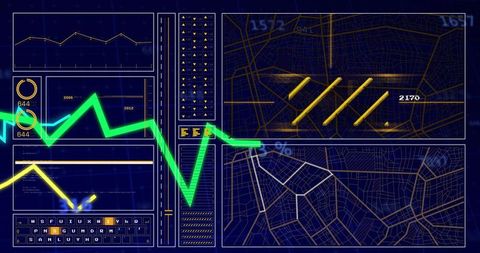
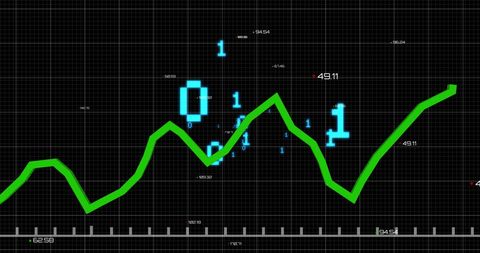
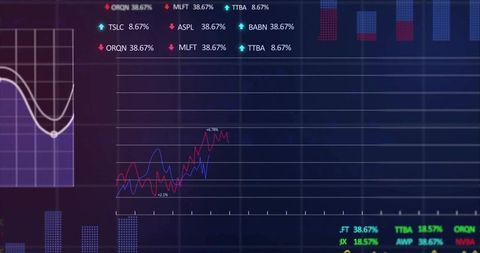
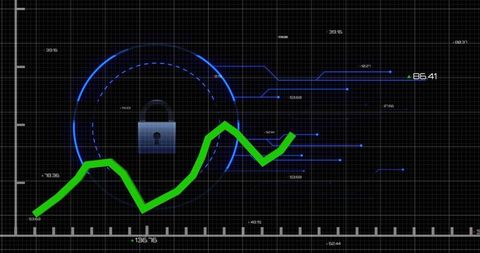
- Displaying futuristic network schematic dashboard showing neon node analytics and data flow
Displaying futuristic network schematic dashboard showing neon node analytics and data flow Free Stock Image

Dark futuristic network schematic featuring thin grid, numeric labels and node markers with neon highlights. Clean geometric layout working well for tech presentations, SaaS landing pages, cybersecurity reports, data analytics dashboards and UI design mockups. Use for header graphic, hero background, slide visual or article illustration for topics such as network architecture, performance monitoring, IoT connectivity and circuit mapping. High contrast and minimal color palette allowing overlaying text, logos or UI elements without losing readability. Capturing flow lines and numeric annotations that suggest routing, throughput and system diagnostics. Suitable for print and digital use including web banners, social media posts, blog headers and whitepaper covers.
Powered by  - Get 15% off with code: PIKWIZARD15


downloads
Tags:
More
Credit Photo
If you would like to credit the Photo, here are some ways you can do so
Text Link
photo Link
<span class="text-link">
<span>
<a target="_blank" href=https://pikwizard.com/photo/displaying-futuristic-network-schematic-dashboard-showing-neon-node-analytics-and-data-flow/b2e85ffddee2f42ea32c8ecd3a822076/>PikWizard</a>
</span>
</span>
<span class="image-link">
<span
style="margin: 0 0 20px 0; display: inline-block; vertical-align: middle; width: 100%;"
>
<a
target="_blank"
href="https://pikwizard.com/photo/displaying-futuristic-network-schematic-dashboard-showing-neon-node-analytics-and-data-flow/b2e85ffddee2f42ea32c8ecd3a822076/"
style="text-decoration: none; font-size: 10px; margin: 0;"
>
<img src="https://thumbs.wbm.im/pw/medium/b2e85ffddee2f42ea32c8ecd3a822076.jpg" style="margin: 0; width: 100%;" alt="Displaying futuristic network schematic dashboard showing neon node analytics and data flow" />
<p style="font-size: 12px; margin: 0;">PikWizard</p>
</a>
</span>
</span>
Free (free of charge)
Free for personal and commercial use.
Author: People Creations
Similar Free Stock Images


Premium


Premium


Premium


Premium


Premium


Premium


Premium


Premium


Premium


Premium


Premium

AI


Premium


Premium


Premium


Premium


Premium


Premium


Premium


Premium


Premium


Premium


Premium


Premium


Premium


Premium

Explore More Free Stock Images