
- Home >
- Free Stock Photos & Images >
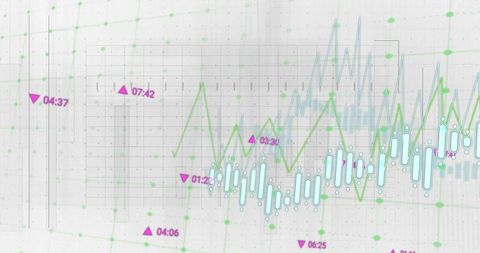
- Displaying global data analytics dashboard with jagged waveform intersecting dotted globe
Displaying global data analytics dashboard with jagged waveform intersecting dotted globe Free Stock Image

Showing dark blue grid background with dotted globe at center and jagged waveform crossing horizontally. Featuring network nodes, triangular mesh and scattered data points for futuristic tech aesthetic. Creating strong visual focal point for data-driven projects such as finance, AI, cybersecurity and big data analytics. Working well for hero banner, presentation slide, report cover, website header, social media post, UI mockup or explainer video background. Allowing overlay text and logo placement thanks to negative space along top and bottom edges. Suggesting teal or cyan color grading and subtle transparency overlays to improve text readability. Helping designers isolate waveform and nodes for custom graphics, icons or animated transitions.
Powered by  - Get 15% off with code: PIKWIZARD15


downloads
Tags:
More
Credit Photo
If you would like to credit the Photo, here are some ways you can do so
Text Link
photo Link
<span class="text-link">
<span>
<a target="_blank" href=https://pikwizard.com/photo/displaying-global-data-analytics-dashboard-with-jagged-waveform-intersecting-dotted-globe/e98d7da559e1839eeb41f16fb9dce5e7/>PikWizard</a>
</span>
</span>
<span class="image-link">
<span
style="margin: 0 0 20px 0; display: inline-block; vertical-align: middle; width: 100%;"
>
<a
target="_blank"
href="https://pikwizard.com/photo/displaying-global-data-analytics-dashboard-with-jagged-waveform-intersecting-dotted-globe/e98d7da559e1839eeb41f16fb9dce5e7/"
style="text-decoration: none; font-size: 10px; margin: 0;"
>
<img src="https://thumbs.wbm.im/pw/medium/e98d7da559e1839eeb41f16fb9dce5e7.jpg" style="margin: 0; width: 100%;" alt="Displaying global data analytics dashboard with jagged waveform intersecting dotted globe" />
<p style="font-size: 12px; margin: 0;">PikWizard</p>
</a>
</span>
</span>
Free (free of charge)
Free for personal and commercial use.
Author: Authentic Images
Similar Free Stock Images


Premium


Premium


Premium


Premium


Premium


Premium


Premium


Premium


Premium


Premium


Premium


Premium


Premium


Premium


Premium


Premium


Premium


Premium


Premium


Premium


Premium


Premium


Premium


Premium


Premium

Explore More Free Stock Images