
- Home >
- Stock Photos >
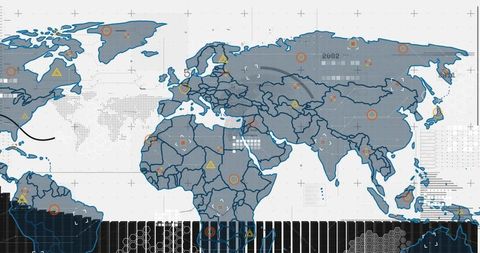
- Displaying Global Data Visualization Interface Yellow World Map and HUD Analytics
Displaying Global Data Visualization Interface Yellow World Map and HUD Analytics Image

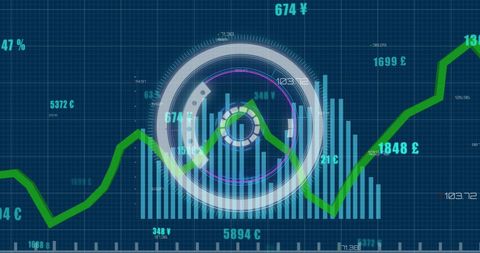
Presenting high-contrast global data visualization featuring yellow world map, circular HUD elements, vertical bargraph histogram, and timeline markers 2002 and 2012. Working well for hero banners, website headers, corporate presentations, annual reports, financial news, and technology blogs. Including transparent overlay space for headline text and KPI figures, left and center areas offering clear composition for typography. Supporting color grading to match brand palettes or increasing yellow saturation for emphasis. Fitting for fintech landing pages, cybersecurity briefings, data-driven marketing campaigns, stock market analysis, supply chain visualizations, and global operations dashboards. Providing futuristic technical mood through gridlines, HUD rings, and numeric overlays. Delivering strong contrast for legible infographic elements on dark backgrounds. Considering horizontal hero crops or full-bleed layouts for immersive effect. Offering room for overlay icons, call-to-action buttons, and animated transitions in video or interactive projects.
Powered by 


downloads
Tags:
More
Credit Photo
If you would like to credit the Photo, here are some ways you can do so
Text Link
photo Link
<span class="text-link">
<span>
<a target="_blank" href=https://pikwizard.com/photo/displaying-global-data-visualization-interface-yellow-world-map-and-hud-analytics/c248bade33cf9586a20185ede64c3f51/>PikWizard</a>
</span>
</span>
<span class="image-link">
<span
style="margin: 0 0 20px 0; display: inline-block; vertical-align: middle; width: 100%;"
>
<a
target="_blank"
href="https://pikwizard.com/photo/displaying-global-data-visualization-interface-yellow-world-map-and-hud-analytics/c248bade33cf9586a20185ede64c3f51/"
style="text-decoration: none; font-size: 10px; margin: 0;"
>
<img src="https://pikwizard.com/pw/medium/c248bade33cf9586a20185ede64c3f51.jpg" style="margin: 0; width: 100%;" alt="" />
<p style="font-size: 12px; margin: 0;">PikWizard</p>
</a>
</span>
</span>
Free (free of charge)
Free for personal and commercial use.
Author: People Creations
Similar Free Stock Images

Premium


Premium

Premium


Premium


Premium


Premium

Premium


Premium

Premium


Premium


Premium


Premium


Premium


Premium

Premium


Premium

Premium

Premium


Premium


Premium

Premium


Premium


Premium


Premium


Premium


Explore More Free Stock Images