- Home >
- Stock Photos >
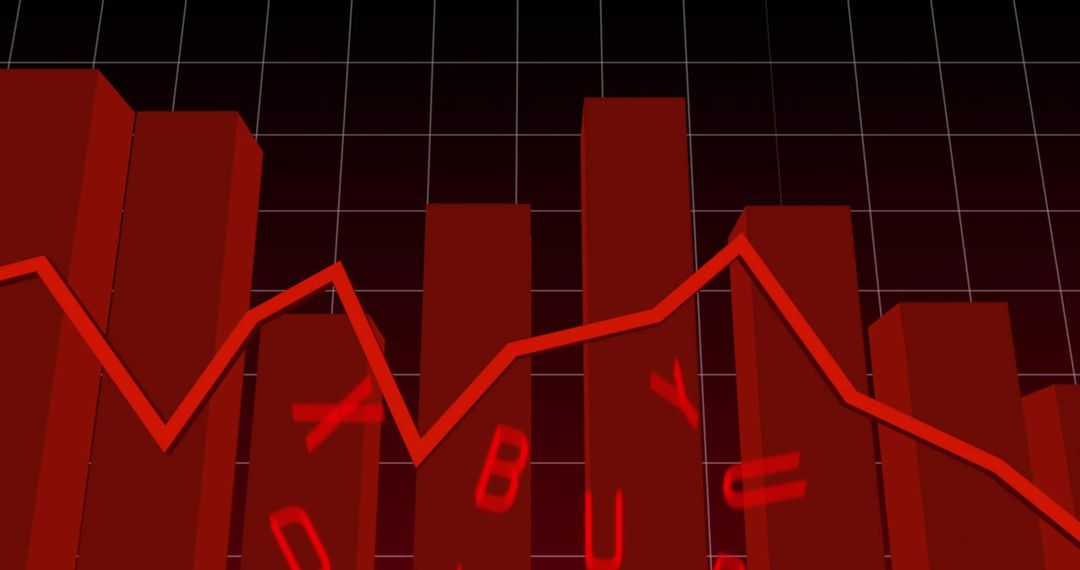
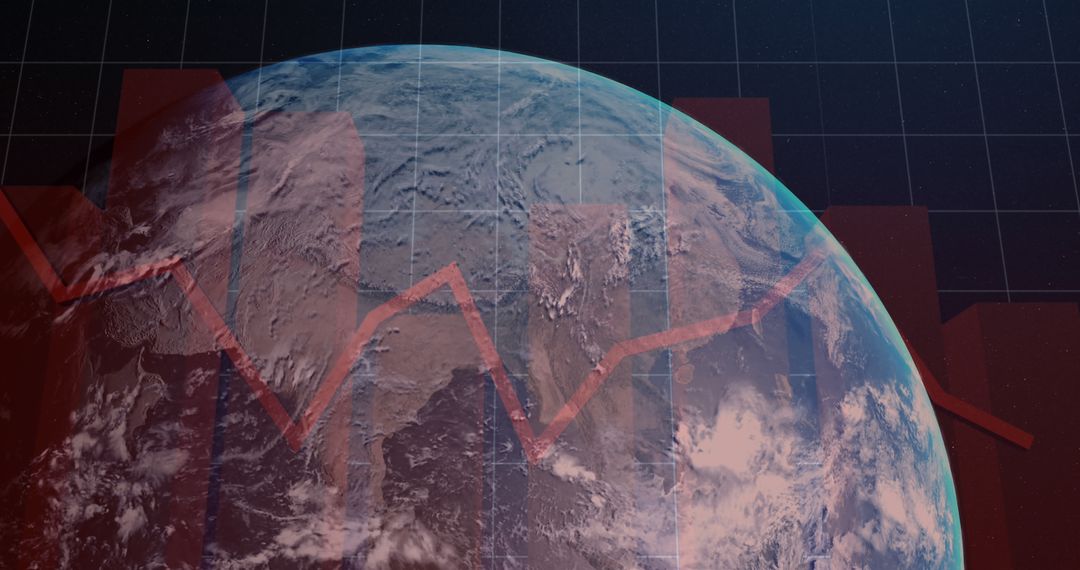
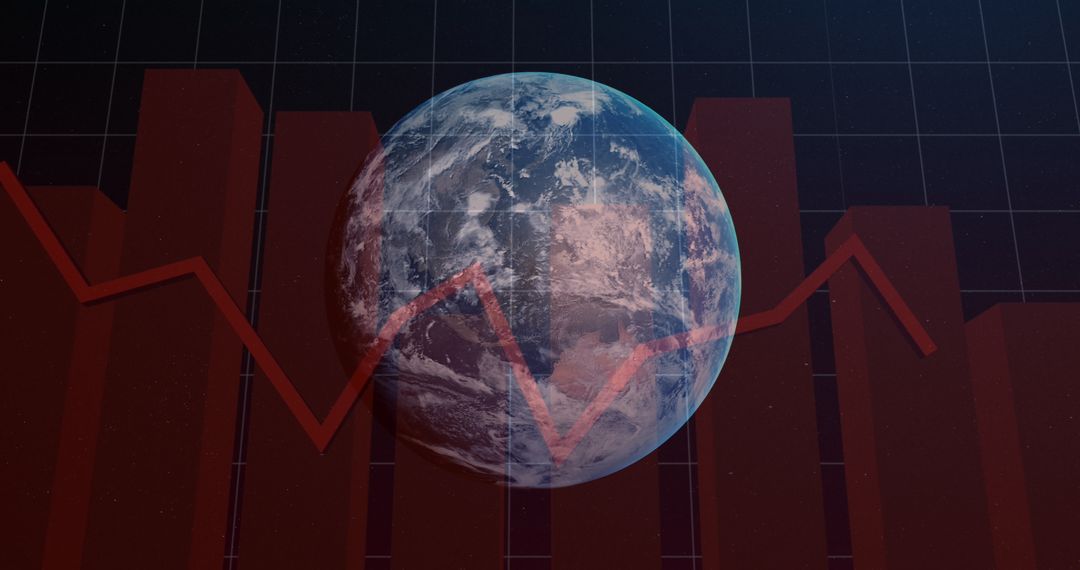
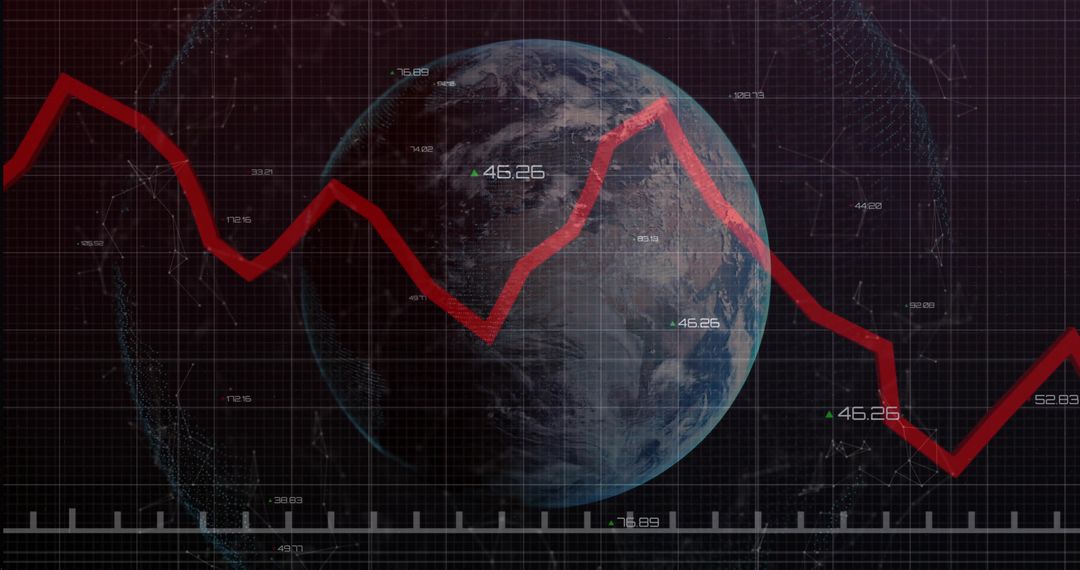
- Displaying global market downturn with red declining bar chart and translucent digital globe
Displaying global market downturn with red declining bar chart and translucent digital globe Image

Visual showing red bar chart and jagged red line over translucent blue globe, conveying global market volatility and economic decline. Dark grid and network dots reinforcing data-driven, tech-focused aesthetic. Suiting finance reports, market analysis presentations, economic news articles, investor briefings, risk management materials, business websites, social media graphics. Working well for headline overlays, infographic panels, landing page headers, presentation slides, newsroom thumbnails, and report covers. Color palette supporting urgent red emphasis while maintaining high-contrast legibility and clear space for text overlays.
Powered by 


0
downloads
downloads
Tags:
More
Credit Photo
If you would like to credit the Photo, here are some ways you can do so
Text Link
photo Link
<span class="text-link">
<span>
<a target="_blank" href=https://pikwizard.com/photo/displaying-global-market-downturn-with-red-declining-bar-chart-and-translucent-digital-globe/cc450056c0d914f546c55323721a8775/>PikWizard</a>
</span>
</span>
<span class="image-link">
<span
style="margin: 0 0 20px 0; display: inline-block; vertical-align: middle; width: 100%;"
>
<a
target="_blank"
href="https://pikwizard.com/photo/displaying-global-market-downturn-with-red-declining-bar-chart-and-translucent-digital-globe/cc450056c0d914f546c55323721a8775/"
style="text-decoration: none; font-size: 10px; margin: 0;"
>
<img src="https://pikwizard.com/pw/medium/cc450056c0d914f546c55323721a8775.jpg" style="margin: 0; width: 100%;" alt="" />
<p style="font-size: 12px; margin: 0;">PikWizard</p>
</a>
</span>
</span>
Free (free of charge)
Free for personal and commercial use.
Author: Authentic Images
Similar Free Stock Images

Premium


Premium


Premium


Premium


Premium


Premium


Premium


Premium


Premium


Premium


Premium


Premium


Premium


Premium


Premium


Premium


Premium


Premium


Premium


Premium


Premium


Premium


Premium


Premium