- Home >
- Stock Photos >
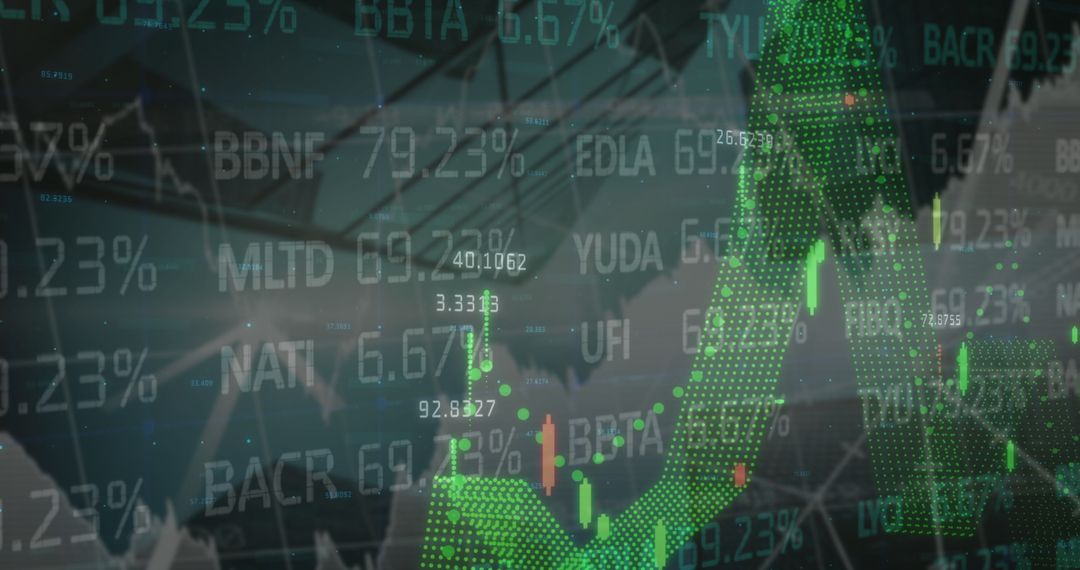
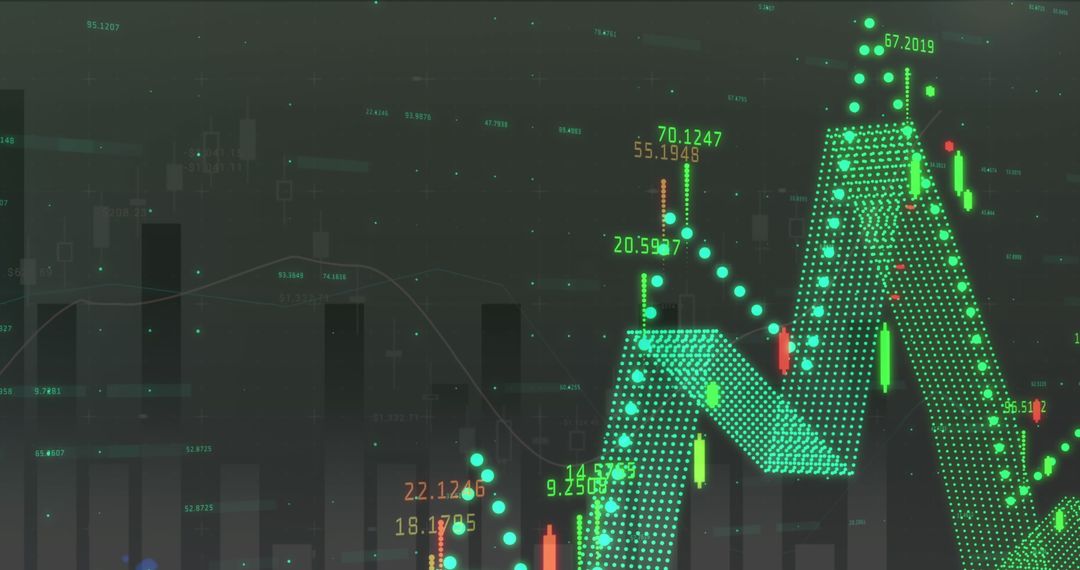
- Displaying green 3D dotted market curve and candlestick trading dashboard
Displaying green 3D dotted market curve and candlestick trading dashboard Image

High-resolution digital artwork showing green dotted 3D market curve rising across virtual dashboard with candlestick overlays, numeric readouts, and floating data particles. Neon color palette creating cyber-finance vibe suitable for fintech, trading platform, and analytics branding. Graphic working well for website hero banners, app interfaces, pitch decks, financial reports, social media posts, and presentation slides. Scene providing visual metaphor for market growth, data-driven strategy, algorithmic trading, and investment performance. Easily combining with overlay text, charts, or UI mockups to illustrate real-time trading, market analysis, or big data visualization. Recommended edits: crop for hero header, apply gradient overlay, add bold CTA text in high-contrast color, or use as background for dashboard demos and promotional materials.
Powered by 


0
downloads
downloads
Tags:
More
Credit Photo
If you would like to credit the Photo, here are some ways you can do so
Text Link
photo Link
<span class="text-link">
<span>
<a target="_blank" href=https://pikwizard.com/photo/displaying-green-3d-dotted-market-curve-and-candlestick-trading-dashboard/b258a780aa6291bc4824ab4932f5f0d2/>PikWizard</a>
</span>
</span>
<span class="image-link">
<span
style="margin: 0 0 20px 0; display: inline-block; vertical-align: middle; width: 100%;"
>
<a
target="_blank"
href="https://pikwizard.com/photo/displaying-green-3d-dotted-market-curve-and-candlestick-trading-dashboard/b258a780aa6291bc4824ab4932f5f0d2/"
style="text-decoration: none; font-size: 10px; margin: 0;"
>
<img src="https://pikwizard.com/pw/medium/b258a780aa6291bc4824ab4932f5f0d2.jpg" style="margin: 0; width: 100%;" alt="" />
<p style="font-size: 12px; margin: 0;">PikWizard</p>
</a>
</span>
</span>
Free (free of charge)
Free for personal and commercial use.
Author: Creative Art
Similar Free Stock Images

Premium


Premium


Premium


Premium


Premium


Premium


Premium


Premium


Premium


Premium


Premium


Premium


Premium


Premium


Premium


Premium


Premium


Premium


Premium


Premium


Premium


Premium


Premium


Premium