- Home >
- Stock Photos >
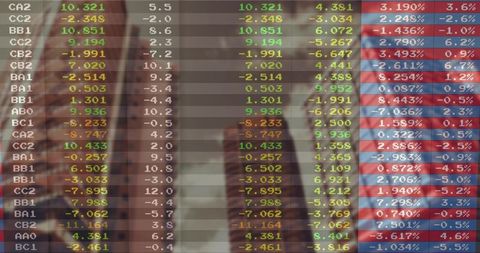
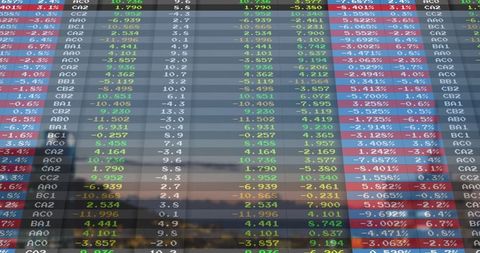
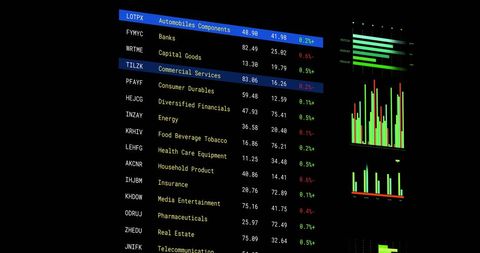
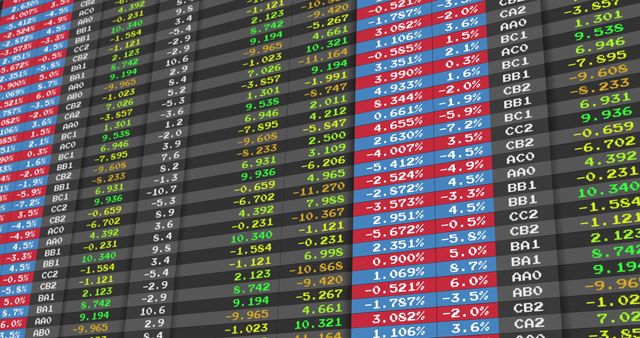
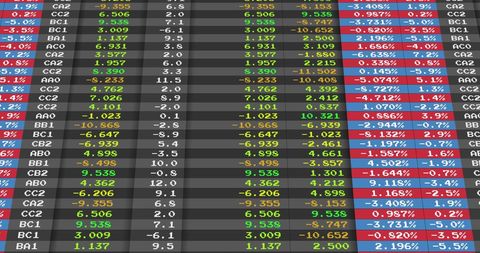
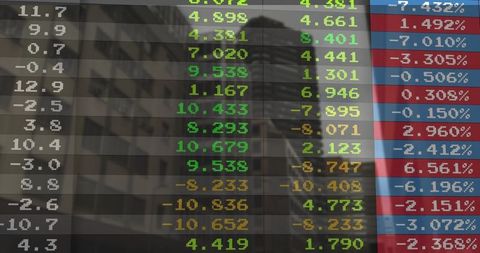
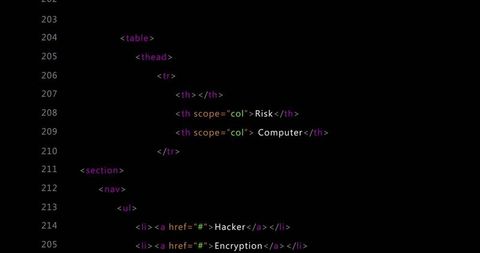
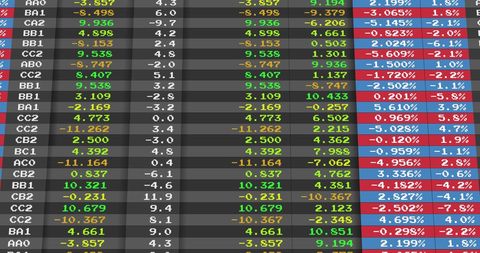
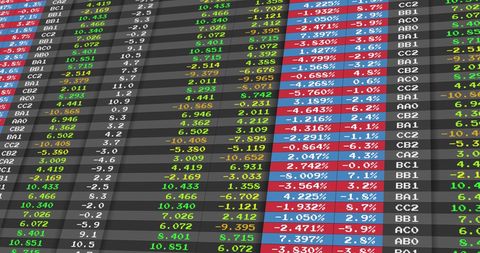
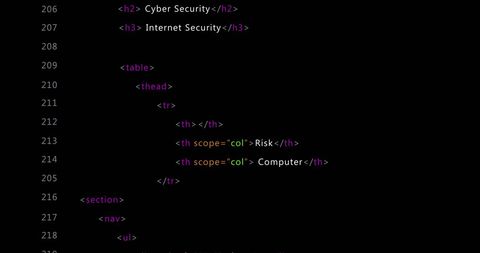
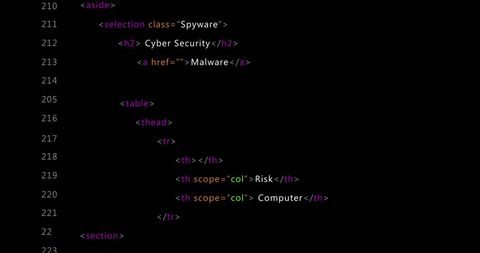
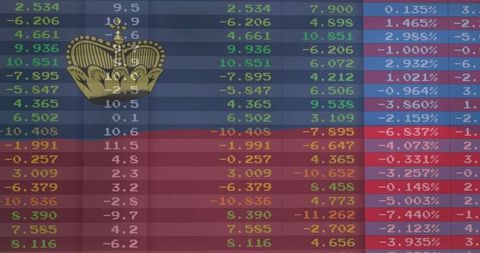
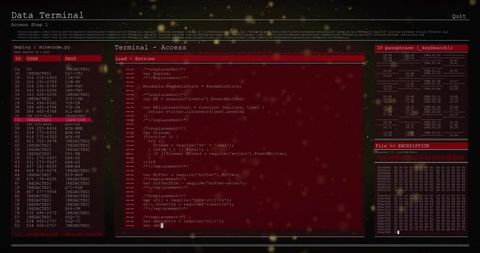
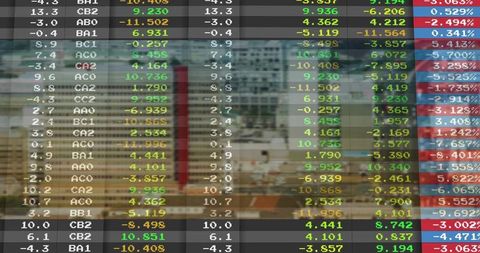
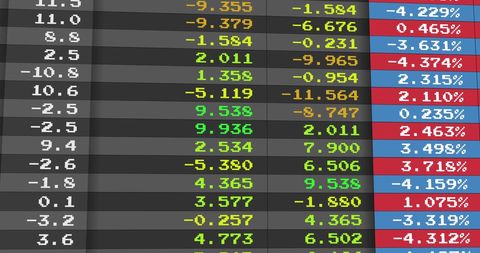
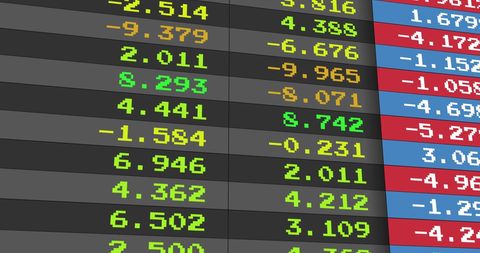
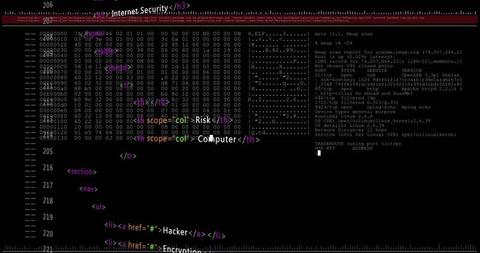
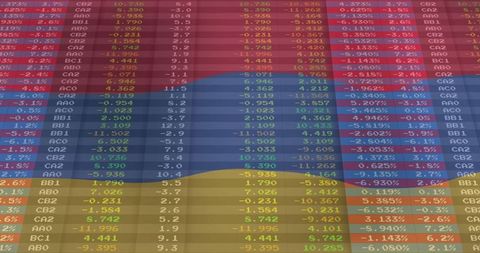
- Displaying layered data dashboard with spreadsheet heatmap and JavaScript code overlay
Displaying layered data dashboard with spreadsheet heatmap and JavaScript code overlay Image

Layered dashboard combining colored spreadsheet heatmap with JavaScript code overlay, showing rows of numerical metrics, percentage changes, and syntax-highlighted code snippets. Dark neon palette creating high-contrast tech aesthetic and sense of real-time monitoring. Conveying intersection of data analytics, software development, finance. Ideal for website hero banners, landing pages for data platforms, analytics dashboards, fintech products, developer tools, cybersecurity and DevOps articles. Working well as background for marketing materials, slide decks, social posts, blog headers, technical presentations and pitch decks. Cropping for tight detail or applying blur for subtle backdrop, adjusting color grade to match brand palette. Supplying alt text and clear captions for accessibility and SEO.

downloads
Credit Photo
If you would like to credit the Photo, here are some ways you can do so
Free (free of charge)
Free for personal and commercial use.
Author: People Creations