- Home >
- Stock Photos >
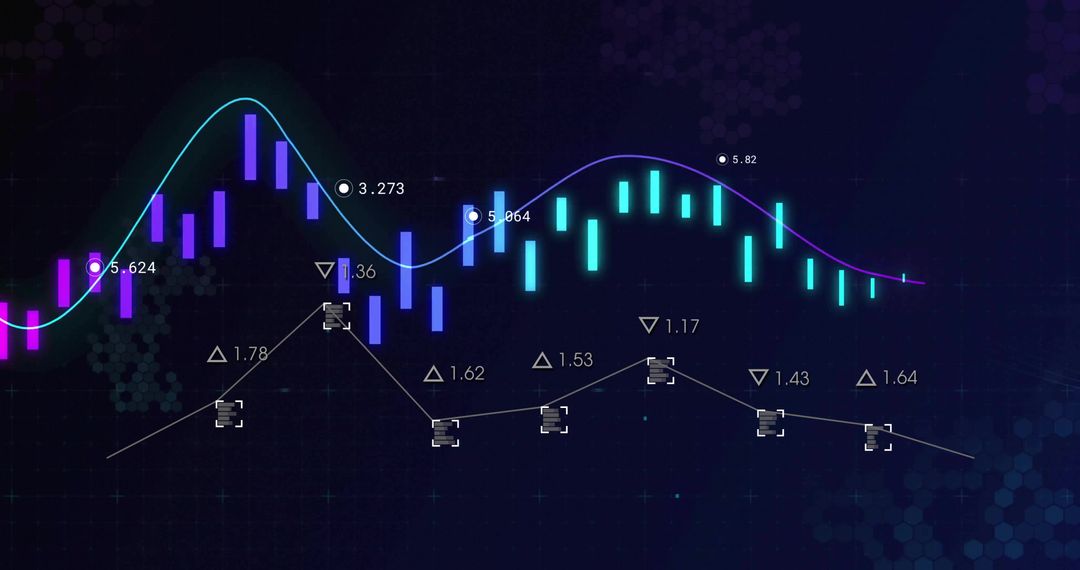
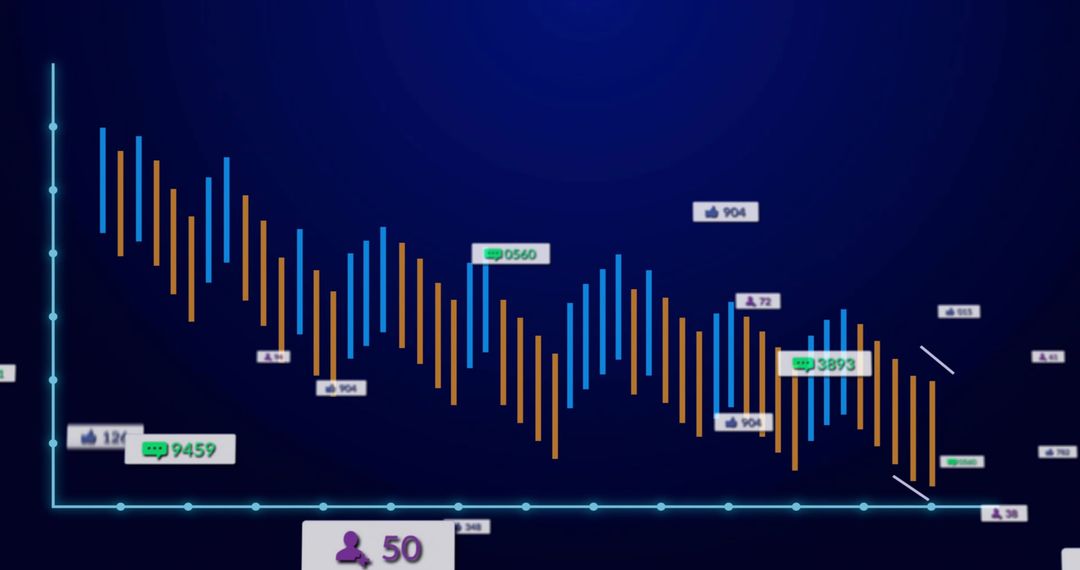
- Displaying multi-series bar chart with smooth trend lines and metric callouts on dark navy backgroun
Displaying multi-series bar chart with smooth trend lines and metric callouts on dark navy backgroun Image

Showing multi-series vertical bars with overlaid smooth trend lines and numeric callouts on dark navy background. Color palette combining deep navy, cyan, lime, beige and magenta accents. Callouts featuring icons for location, users, likes and numeric values. Perfect for presenting dashboard mockups, illustrating analytics reports, supporting financial presentations, enhancing marketing performance slides and improving UX interfaces. Working well as hero header, landing page background, social post or slide deck visual. Allowing room for overlaying text, logo or custom data labels. Delivering modern, minimal aesthetic while keeping focus on data patterns and trend comparison. Suitable for designers, analysts, marketers and presenters looking to visualize KPIs, market trends and social metrics.
Powered by 


0
downloads
downloads
Tags:
More
Credit Photo
If you would like to credit the Photo, here are some ways you can do so
Text Link
photo Link
<span class="text-link">
<span>
<a target="_blank" href=https://pikwizard.com/photo/displaying-multi-series-bar-chart-with-smooth-trend-lines-and-metric-callouts-on-dark-navy-backgroun/40e645ac090a3533337b0943a1799850/>PikWizard</a>
</span>
</span>
<span class="image-link">
<span
style="margin: 0 0 20px 0; display: inline-block; vertical-align: middle; width: 100%;"
>
<a
target="_blank"
href="https://pikwizard.com/photo/displaying-multi-series-bar-chart-with-smooth-trend-lines-and-metric-callouts-on-dark-navy-backgroun/40e645ac090a3533337b0943a1799850/"
style="text-decoration: none; font-size: 10px; margin: 0;"
>
<img src="https://pikwizard.com/pw/medium/40e645ac090a3533337b0943a1799850.jpg" style="margin: 0; width: 100%;" alt="" />
<p style="font-size: 12px; margin: 0;">PikWizard</p>
</a>
</span>
</span>
Free (free of charge)
Free for personal and commercial use.
Author: Creative Art
Similar Free Stock Images

Premium


Premium


Premium


Premium


Premium


Premium


Premium


Premium


Premium


Premium


Premium


Premium


Premium


Premium


Premium


Premium


Premium


Premium


Premium


Premium


Premium


Premium


Premium


Premium