1. Home > 
  2. Stock Photos > 
  3. Displaying Neon 3D Dotted Financial Chart with Candlesticks, Analytics Tags and Indicators

Displaying Neon 3D Dotted Financial Chart with Candlesticks, Analytics Tags and Indicators Image

Displaying Neon 3D Dotted Financial Chart with Candlesticks, Analytics Tags and Indicators

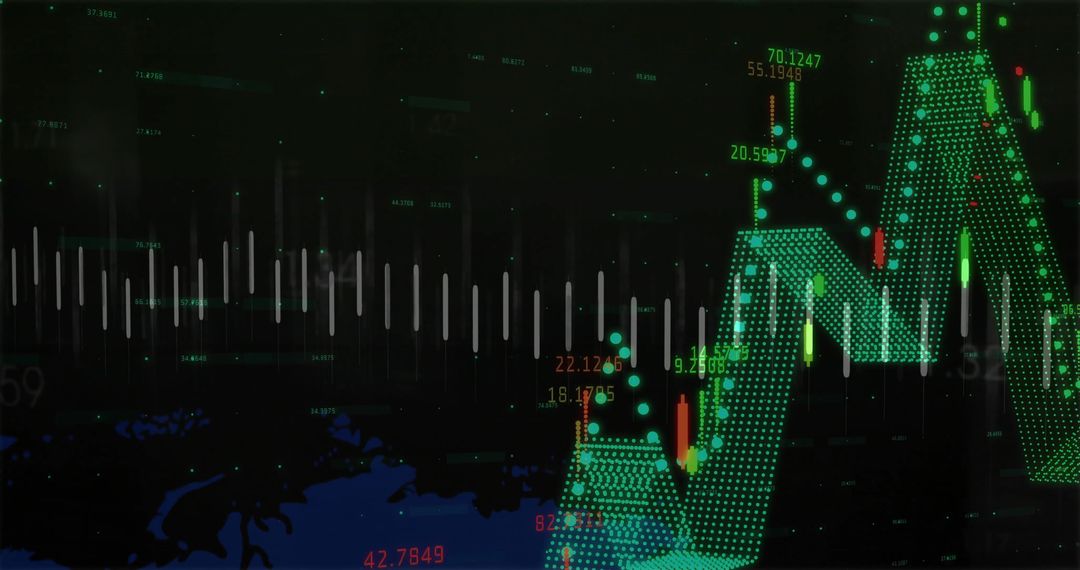
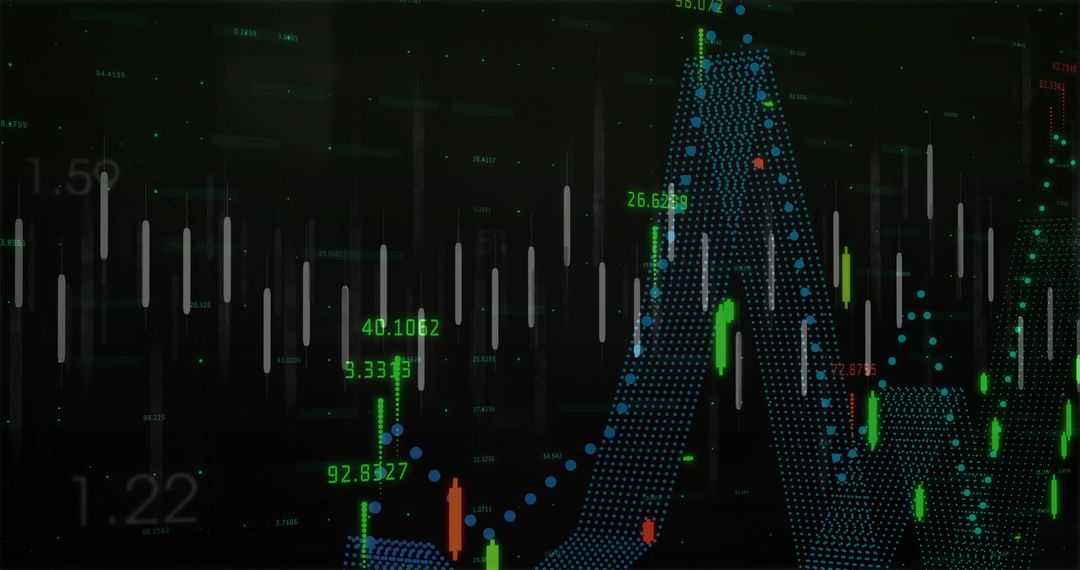
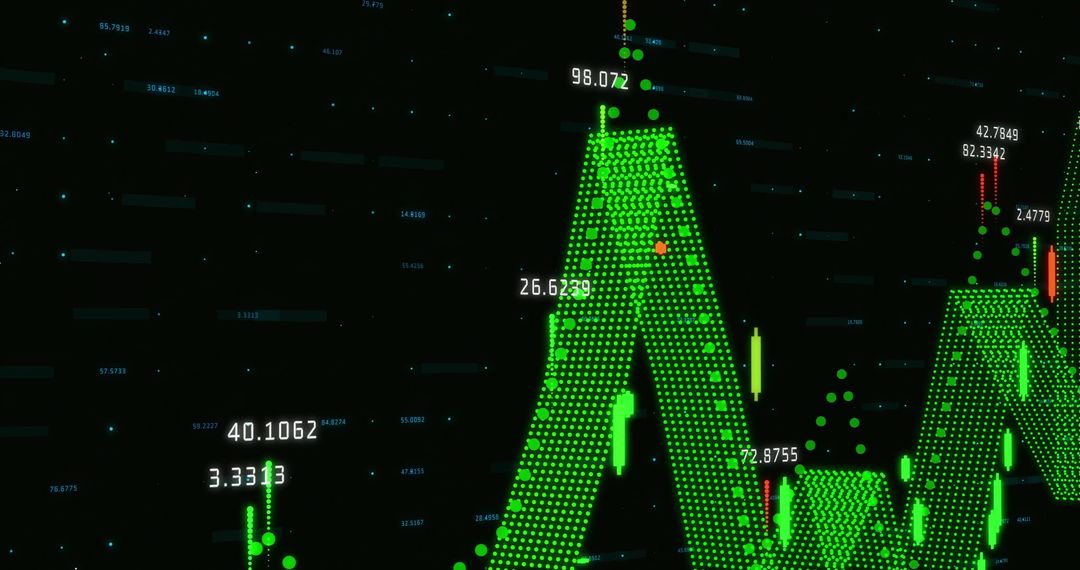
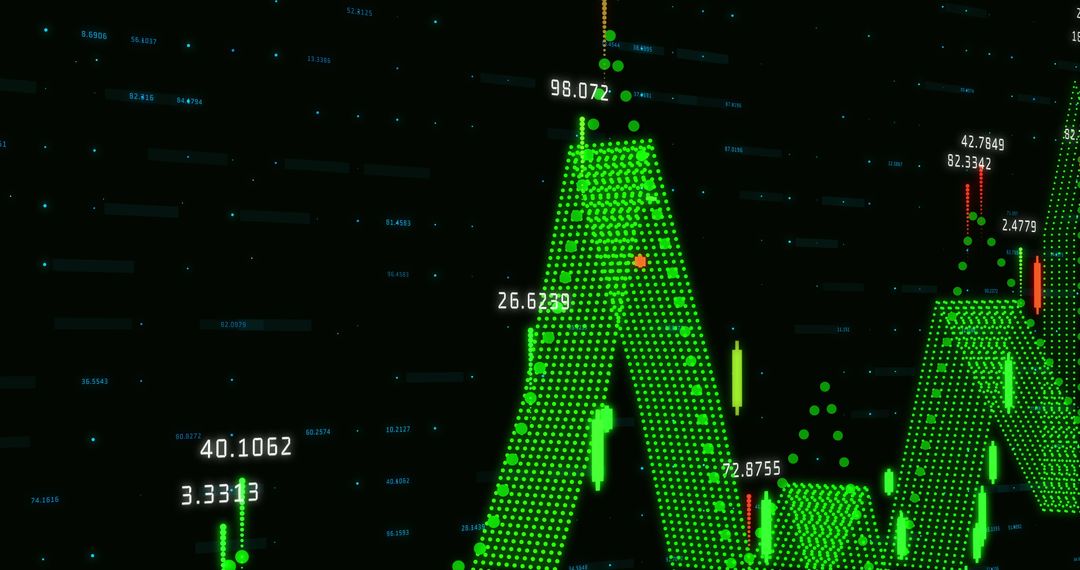
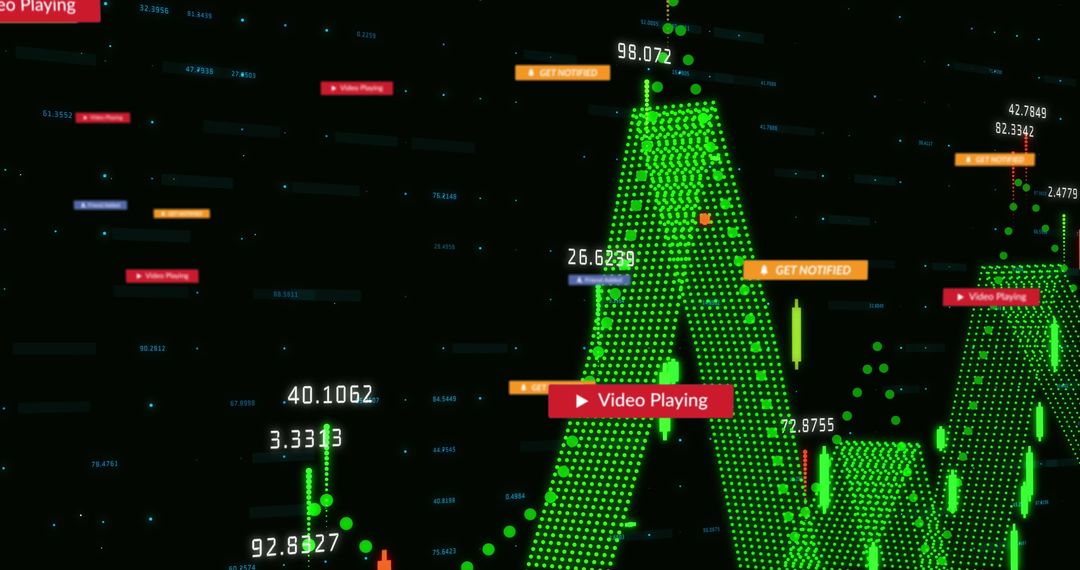
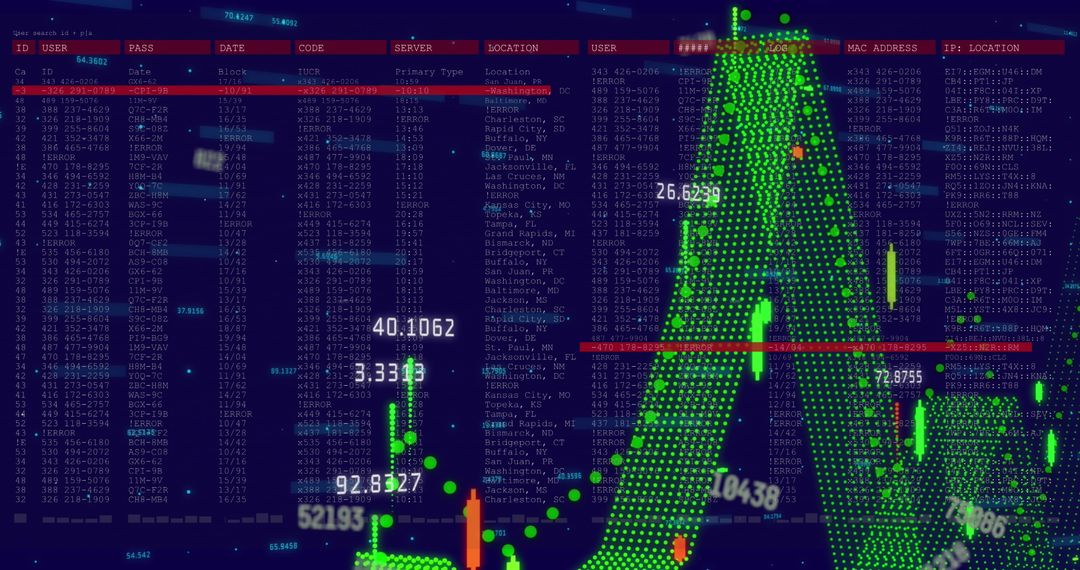
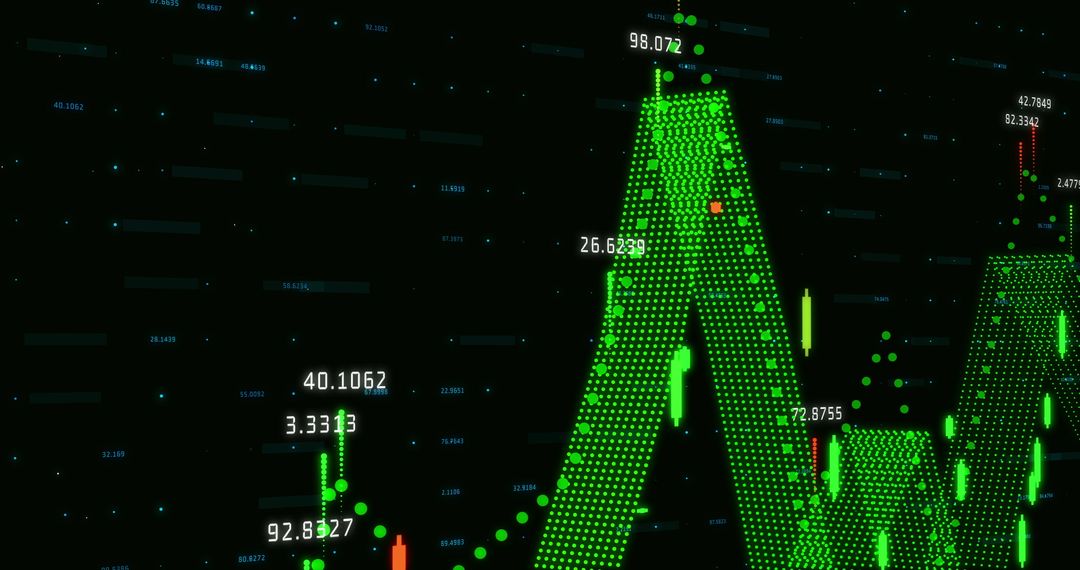
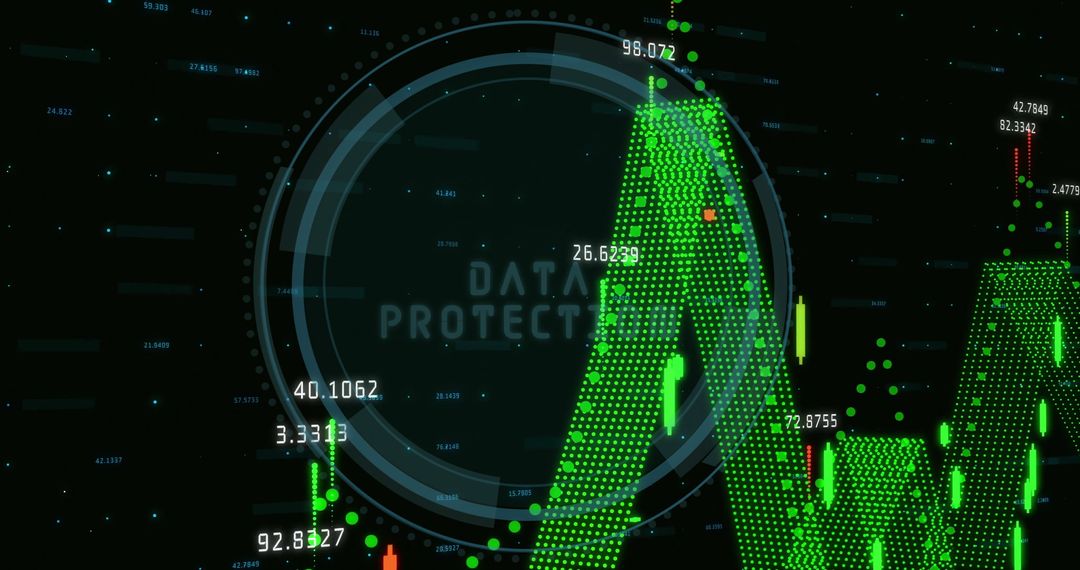
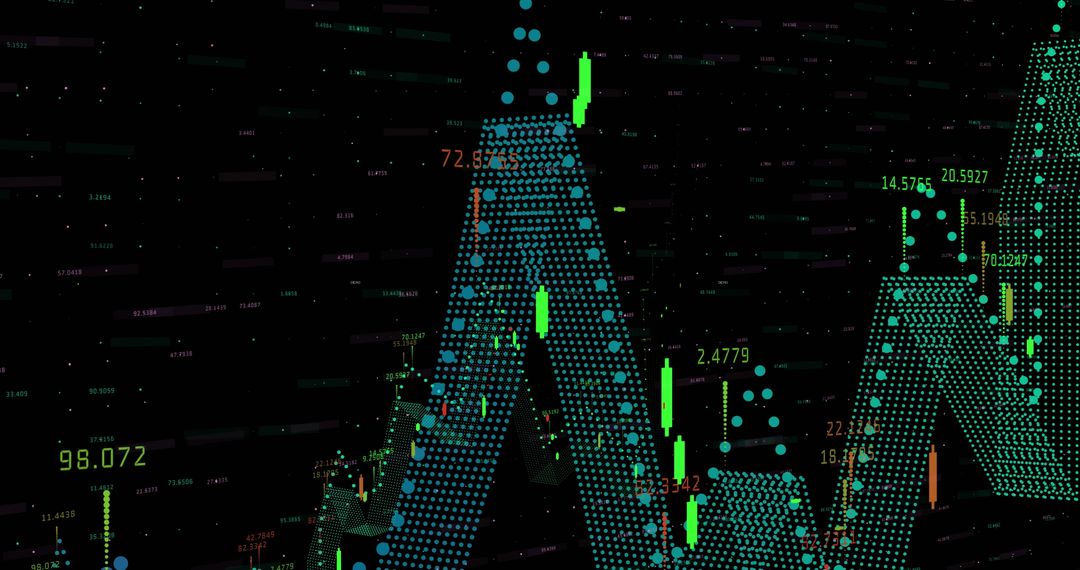
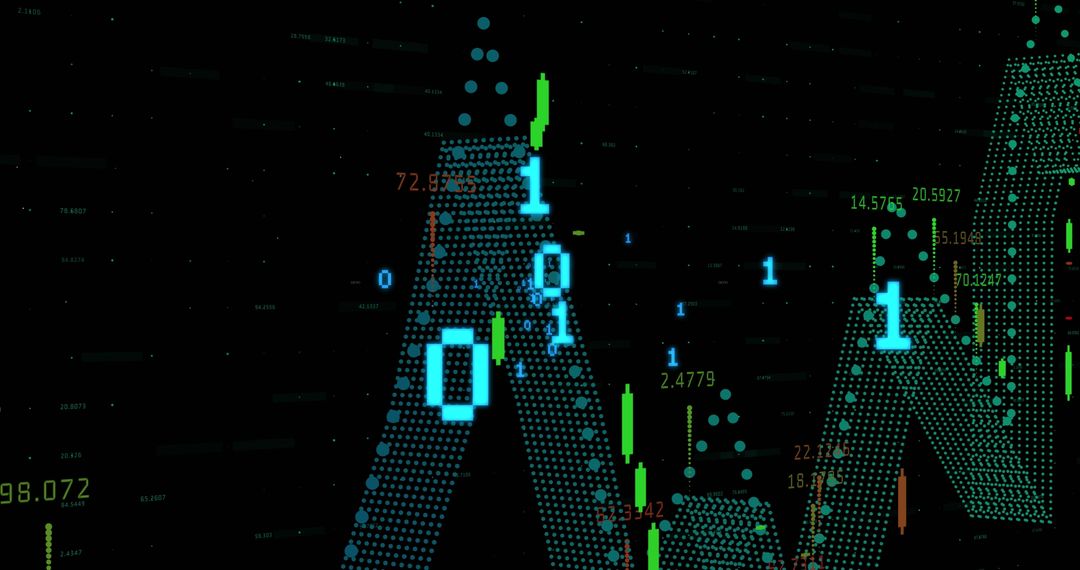
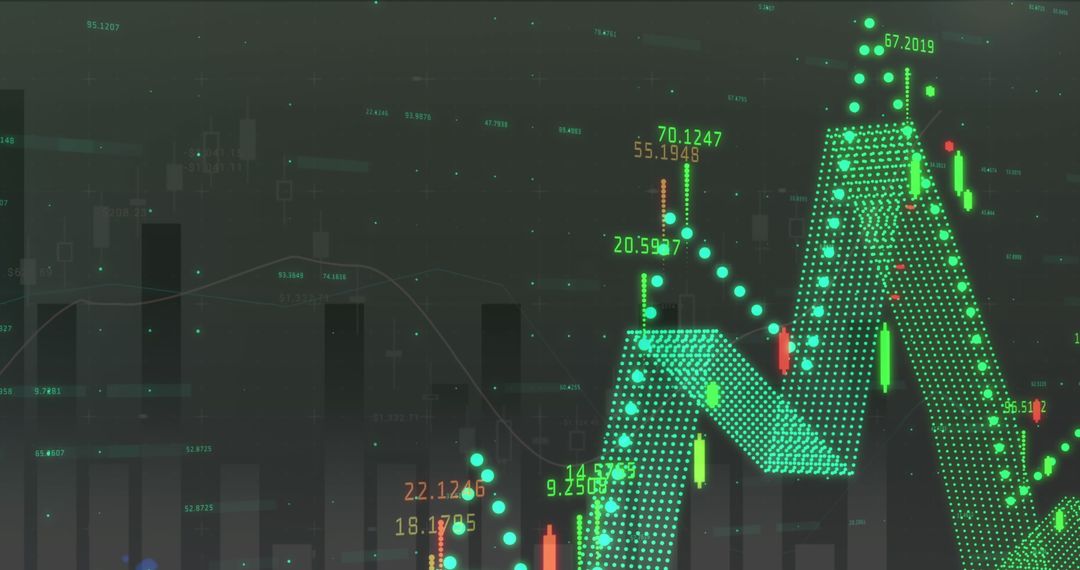
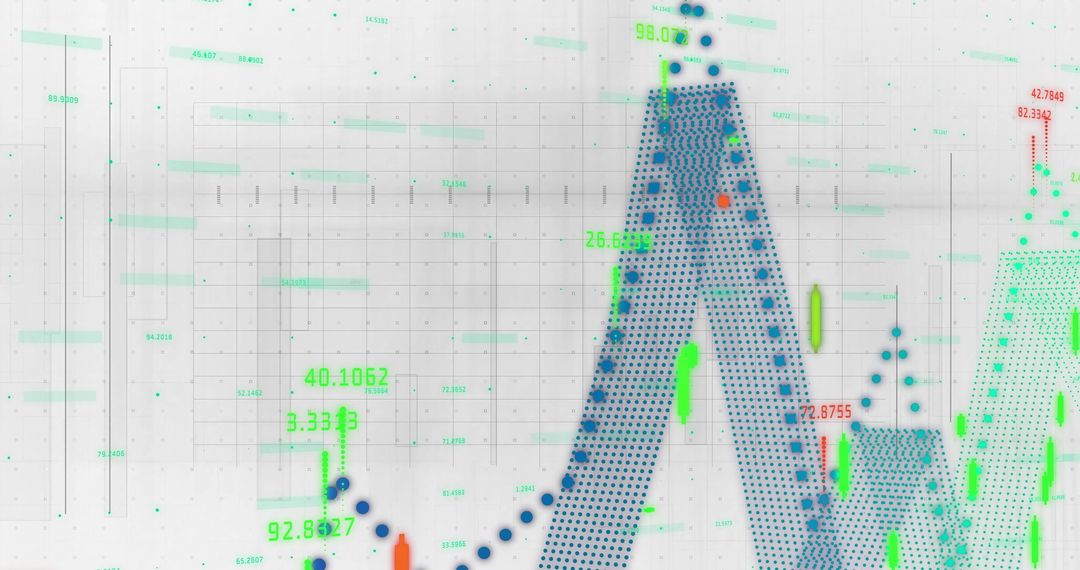
Displaying neon green 3D dotted financial chart with candlestick bars, point markers, and floating numeric tags. Combining mesh-style dots, glowing HUD elements, and numeric overlays for modern fintech aesthetic. Suitable for illustrating trading analysis, market trends, price movement, technical indicators, and data-driven dashboards. Use in website hero banners, financial reports, blog headers, app interfaces, pitch decks, and marketing materials for trading platforms or fintech startups. Providing strong visual metaphor for volatility, volume spikes, algorithmic trading, and real-time analytics. Customizable color overlays and cropping for section headers or social media posts. High contrast neon palette drawing attention on dark backgrounds and supporting text overlays or data callouts.

Powered by Shutterstock logo - Get 15% off with code: PIKWIZARD15
Analysis finance grow graph and market  investment. Financial  business plan,earnings,sale and strategy. Stock market chart, exchange financial growth diagram. - Powered by Shutterstock - Get 15% off with code: PIKWIZARD15Online trading, Investment, Strategy market plan, and Stock mark - Powered by Shutterstock - Get 15% off with code: PIKWIZARD15Stock market or forex trading graph in futuristic concept suitable for financial investment or Economic trends business idea and all art work design. Abstract finance background - Powered by Shutterstock - Get 15% off with code: PIKWIZARD15Stock market or forex trading graph on touchscreen,  finance and investment concept. Economy trends for business, financial charts and digits. - Powered by Shutterstock - Get 15% off with code: PIKWIZARD15abstract Financial chart with moving up growing stock market graph in blue light color background - Powered by Shutterstock - Get 15% off with code: PIKWIZARD15

Credit Photo

If you would like to credit the Photo, here are some ways you can do so

Free (free of charge)

Free for personal and commercial use.

Author: Creative Art

Similar Free Stock Images

Colorful Digital Stock Market Graph on Grid Background
Premium
Stock market graph trading analysis investment financial, stock exchange financial or forex graph stock market graph chart business crisis crash loss and grow up gain and profits win up trend.
Financial Data Overlay on Cityscape Visualizing Market Trends
Digital Financial Data Overlaying Skyline of Modern City
Financial Data Flow against Urban Skyline Backdrop
Digital Data Analytics Overlay on Cityscape
Premium
Financial Expert Reviews Market Projections and Investment Strategies on Computer
Concept of Financial Data Analysis with Digital Elements
Global Finance and COVID-19 Impact Representation
Digital Financial Data Visualization with Graphs and Charts
Visual Display of Abstract Financial Data
Premium
Money business financial graph diagram of coin. Financial growth data or investment market profit bar and success report.Saving money concept.Stack of coins with trading price graph growth.
Futuristic Digital Data Visualization with Holographic Interface
Abstract Financial Data Visualization with Graphs
World Map with Digital Financial Data Visualization
Financial Data Analysis Overlaying Cityscape
Premium
Two diverse crypto traders brokers stock exchange market investors discussing trading charts research reports growth using pc computer looking at screen analyzing invest strategy, financial risks.
Digital Data Analysis over Cityscape Stock Market Concept
Data Visualization on Digital Grid with Technological Interface
Abstract Financial Data Analysis and Stock Market Trends
Financial Data Graph with Digital Elements and Growth Indicators
Premium
Up stock market time icon vector for finance, trading, and investment growth visuals. Ideal for economic forecasts, bullish charts, business gains, and global financial planning themes.
Tech Growth Analysis with Dynamic Data Visualization
Digital Financial Chart Overlay on Modern City Skyline
Dynamic Financial Data Visualization with Binary Code Overlay
Financial Data Analytics with Digital Visualization Concept
Premium
Technical price graph and indicator, red and green candlestick chart on blue theme screen, market volatility, up and down trend. Stock trading, crypto currency background.
Digital Interface Displaying Financial Market Trends
Futuristic 3D Finance Dashboard with Neon Waveform and Candlesticks
Analytical Dashboard with Candlestick Chart and Dotted Trend Line
Displaying Neon 3D Dotted Financial Chart with Candlesticks, Numeric Labels, Analytics
Futuristic Stock Market Graph with Digital Data
Digital Finance Analytics with Stock Market Data
Premium
Stock market analysis, business, finance and investment. Finance analyst analyzing stock market trading graph, economic growth chart, planning and strategy, business investment with financial report
Abstract Financial Market Data Analysis Visualization
Dynamic Financial Graph Visualizing Market Trends
Advanced Digital Graph Illustrating Stock Market Trends
Dynamic Stock Market Graph Displaying Surging Growth
Premium
Graph Chart Stock Market Candle Stick Trade Business Data Growth Money Diagram blur Blue Background, Abstract Global Forex Bitcoin Crypto currency, Technology Analysis Exchange Profit Success.
Digital Interface with Data Graphs and Charts on Blue Background
Abstract Digital Financial Data Chart with Pink Line Oscillations
Digital Notifications and Holographic Data Visualization
Dynamic Financial Data with Graph Trends and Statistics
Premium
Stock Market Chart on Blue Background. share drop down
Abstract Network Connections with Financial Data Overlay
Dynamic Data Processing Concept in Digital Interface Design
Financial Data Overlay on Scrolling Digital Stock Market Data
Dynamic Financial Data and Technology Visualization
Premium
Stock market chart, exchange financial growth diagram.Analysis finance grow graph and market investment. Financial business plan,earnings,sale and strategy.
Data Analysis Graphics on Digital Grid Background
Financial Data Analysis with Abstract Chart Grid Overlay
Digital Data and Financial Charts on White Background
Data Visualization on Digital Interface with Graphs and Codes
Premium
Investors analyze the data stock market index via smartphone screen to trade the stock chart for planning investments take profit, trade stock exchange market and cryptocurrency data, financial.
Futuristic Data Processing on Digital Interface Concept
Global Network Connectivity and Data Processing on World Map
Dynamic Graphic of Financial Data Displayed on Graph
Futuristic Neon Data Dashboard with Vibrant Analytics Tooltip
Premium
Stock market graph trading analysis investment financial, stock exchange financial or forex graph stock market graph chart business crisis crash loss and grow up gain and profits win up trend
3D Candlestick Chart with Social Media Reactions
Neon Line Graphs on Dynamic Data Dashboard for Analytics
Animating Neon 3D Candlestick Trading Chart on Virtual Grid with Glowing Code Overlay
3D Stock Market Graph in Digital Display
Digital Data and Cloud Computing with Green Light Effects
Abstract Digital Financial Analytics with Data Visualizations
Premium
Stock market or forex trading graph and candlestick chart suitable for financial investment concept. Economy trends background for
Digital Finance Data Overlapping Urban Skyline
Green Line Rising on Digital Trading Board with Abstract Background
Dynamic Stock Market Graphs and Financial Data
Digital Interface Showing Data Protection and Financial Trends
Premium
Stock market graph trading analysis investment financial, stock exchange financial or forex graph stock market graph chart business crisis crash loss and grow up gain and profits win up trend
Digital Financial Data Processing with Graphs and Charts
Holographic Charts with Social Media Notifications
Cybernetic Data Flow with Digital Network Connections
Dynamic Financial Data Visualization on Digital Grid Background
Premium
Businessman pointing chart financial goals and economic business planning global.
Digital Graph with Rising and Falling Lines on Grid Background
Digital Abstract with Growth Analysis Graphics
Digital Cityscape with Financial Data Overlay
Abstract Data Visualization on Blue Background for Technology Concept
Premium
Trading investment charts. investment finance concept.
Financial Data Analysis on Blue Digital Interface
Global Business Finance Data Analysis Visualization
Financial Data Visualization with Binary Coding in Green-Blue Palette
Dynamic Financial Data Projection in Modern Office Environment
Premium
Businessman analyzing forex trading graph financial data. Business finance background.business finance technology and investment concept. Stock Market Investments Funds and Digital Assets.
Financial Data with Molecular Background Concept
Digital Financial Data Graph on Black Screen Background
Global Financial Data Trends on Digital World Map Display
Financial Analysis Concept with Modern Chart Display
Premium
Stockmarket online trading chart candlestick on crypto currency platform. Stock exchange financial market price candles graph data pattern analysis concept. Computer screen closeup background
Cyan Data Stream Visualizing Social Engagement Metrics on Dark Analytics Dashboard
Neon Candlestick Chart Visualizing Stock Market Data with Glowing Lines, Magenta Markers
Digital Financial Market Data Visualization
Digital Financial Data on Black Background with Graphs
Digital Financial Data and Market Analytics Concept
Dynamic Financial Data Chart with Green Line Graph
Premium
Businesswomen use magnifier glass find stock in stock markets, uptrends, growth economics, business strategy development, and opportunities for investment, take profit from funds, Financial Analyst.
Inflation Concept with Digital Data Indicators
Cryptocurrency Data with Digital Analytics Overlay
Futuristic Digital Data Processing and Analysis Concept
Digital Stock Market Green Graph Against Dark Trading Board
Premium
Stock graph and financial chart. Analyze stock market finance volume of stock market with Graph and chart holograph technology. High quality photo
Digital Global Communication and Social Interactions Concepts
Colorful Bar Graph with Data Overlay on Black Background
Dynamic Graph Analysis on Futuristic Digital Screen
Colorful Financial Data Analytics and Global Market Trends
Premium
Bangkok night cityscape and forex stock market hologram, candlesticks dynamics and statistics, bar chart with numbers. Concept of money investment, trading and profit
Dynamic Stock Market Chart with Time Indicators and Data Trends
Data Trends Overlayed on Cityscape Skyscrapers
Data Visualization on Blue Digital Interface
Advanced Financial Data Network Over World Map
Premium
Stock market analysis, business, finance and investment. Finance analyst analyzing stock market trading graph, economic growth chart, planning and strategy, business investment with financial report.
Analyzing Financial Data on Digital World Map Background
Digital Stock Market Display with Data Analysis Graphics
Financial Data Visualization on World Map with Graph Analytics
Digital Financial Data Analysis on Grid Framework
Premium
Stack of money coin and magnifying glass with graph and candle stick chart. Business and financial concept. Stock market analyzing, stock information search.
Financial Data Visualization with Digital Pulse and Charts
Modern Data Analyzing Dashboard with 3D Chart Visualization
Digital Finance Dashboard Showing Candlestick and Line Charts
Dynamic Data Dashboard with Multicolored Trendlines and Chart Bars
Premium
Stock market financial investment and trading graph interface showing ticker price evolution with candlestick chart and moving average curves. Increasing profit. Forex. Person touching virtual screen.
Green Dotted Market Mesh Chart Displaying Candlestick Patterns and Volatility Dashboard