- Home >
- Stock Photos >
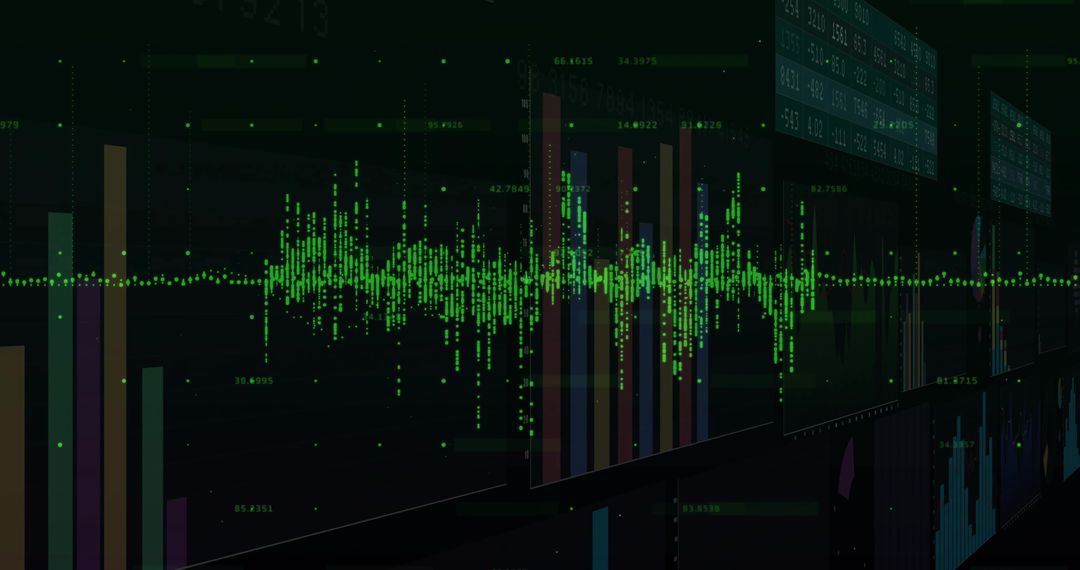
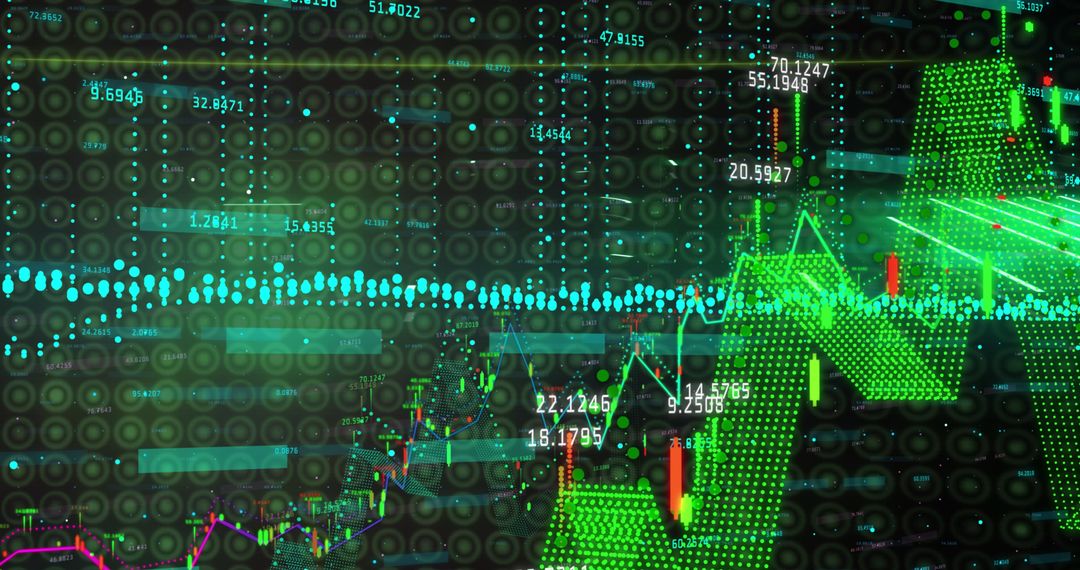
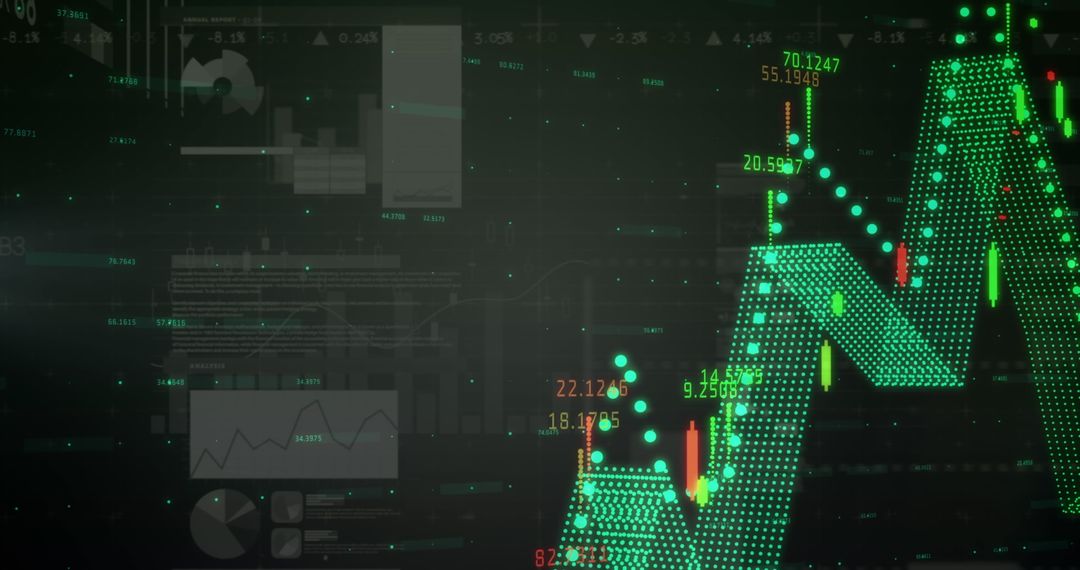
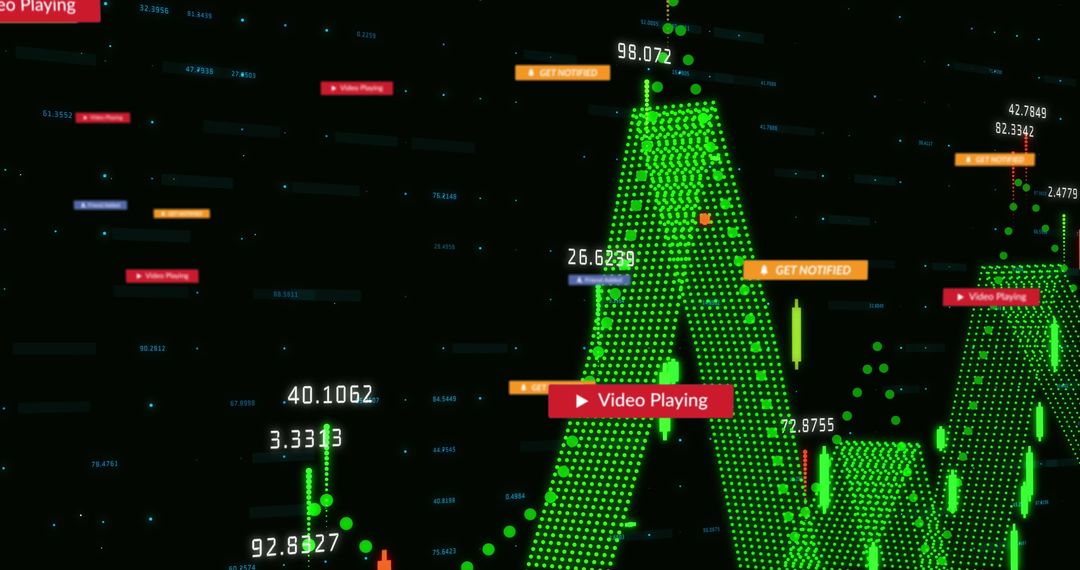
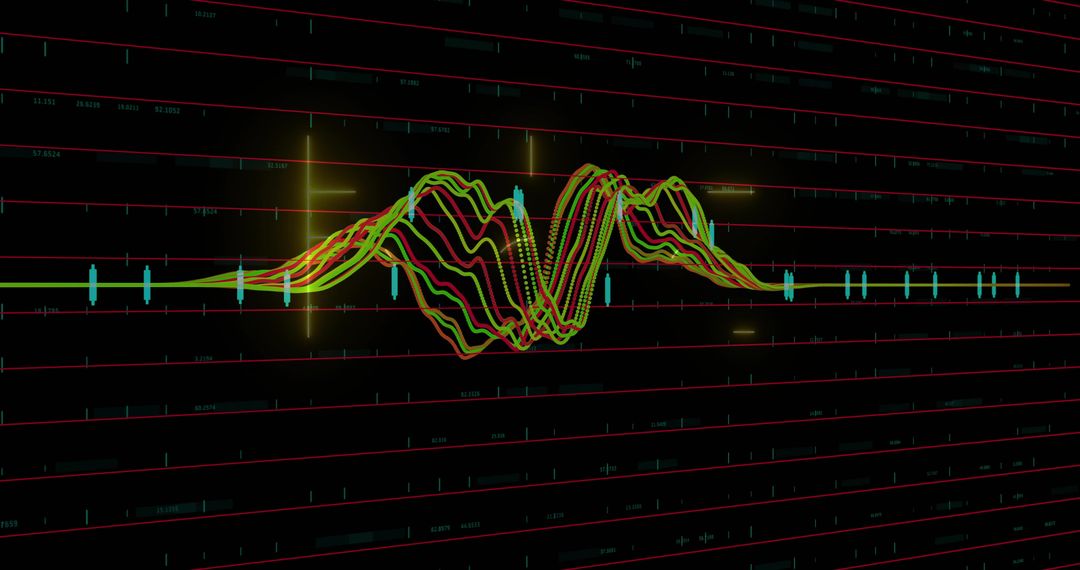
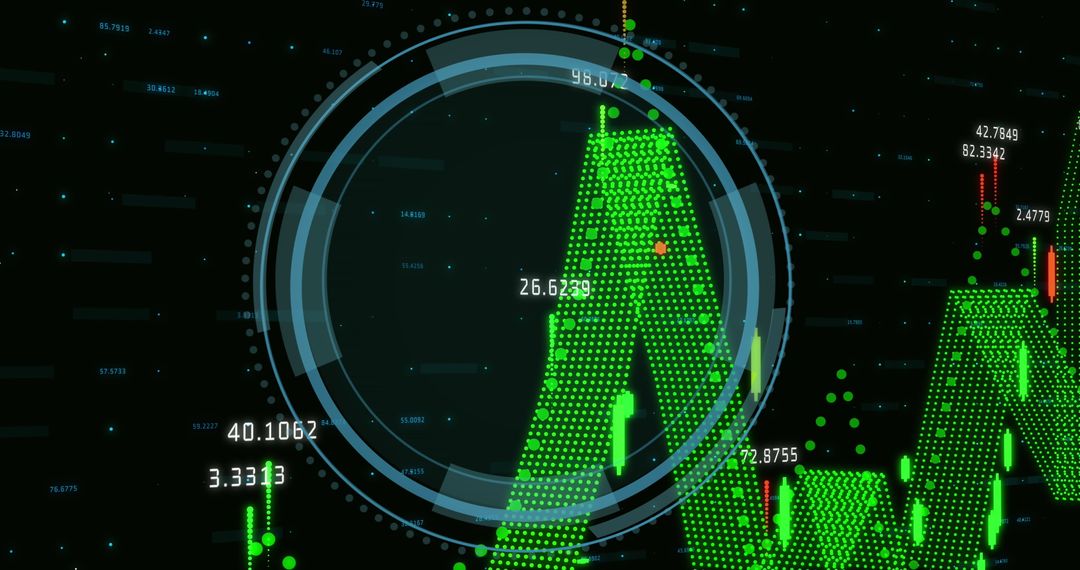
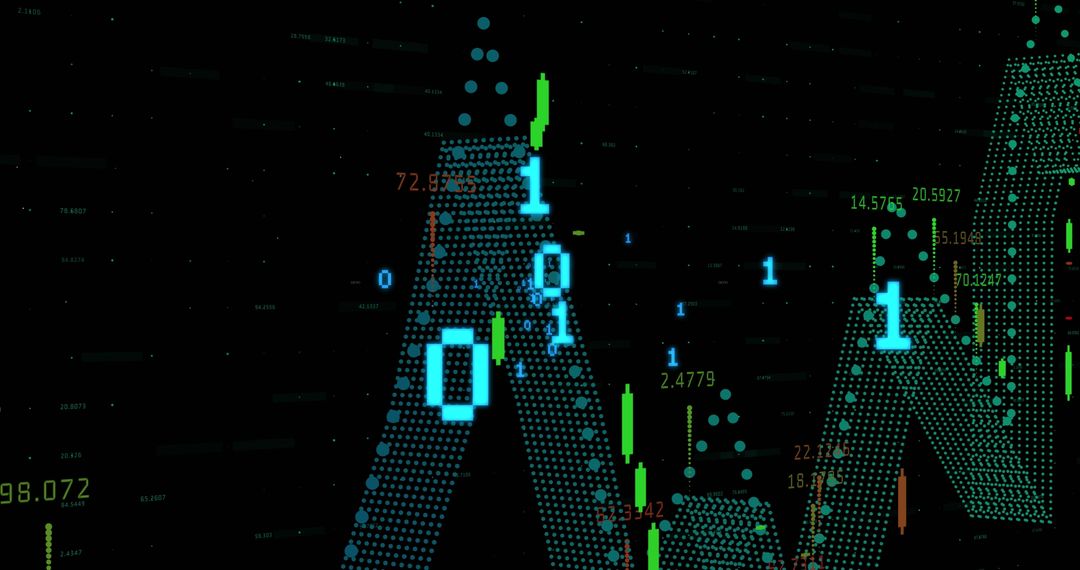
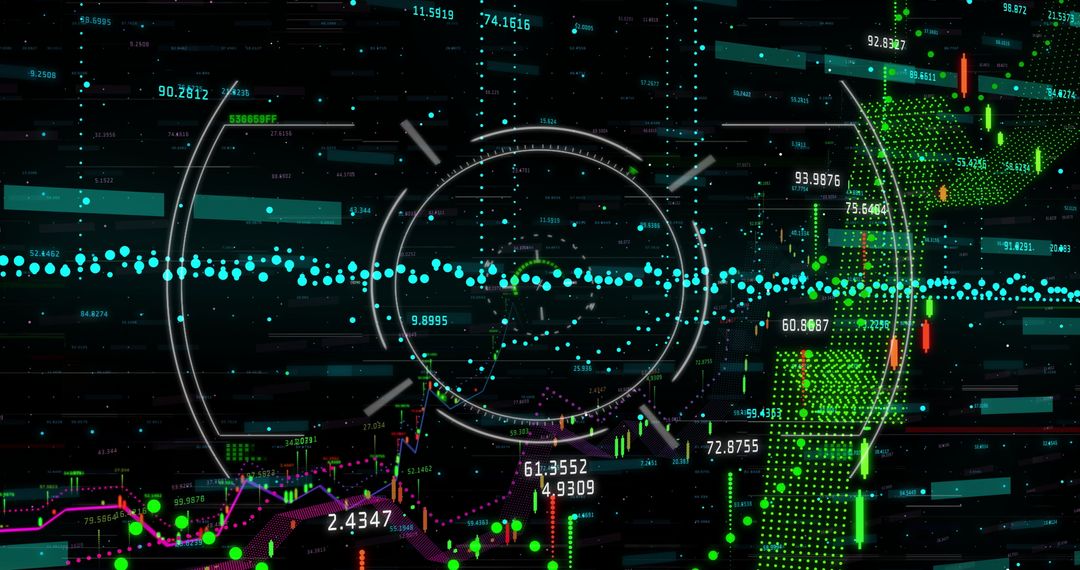
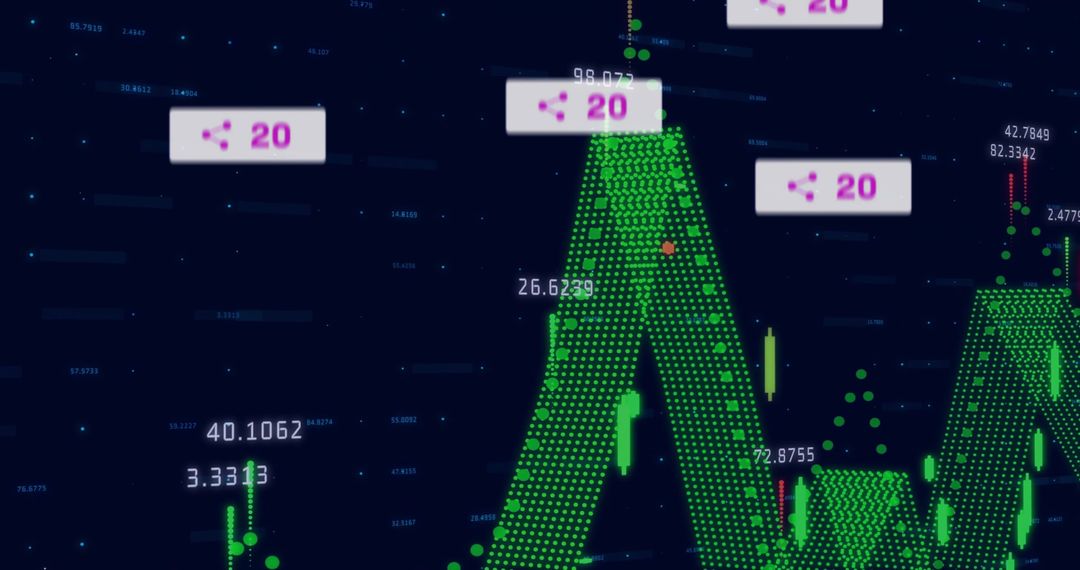
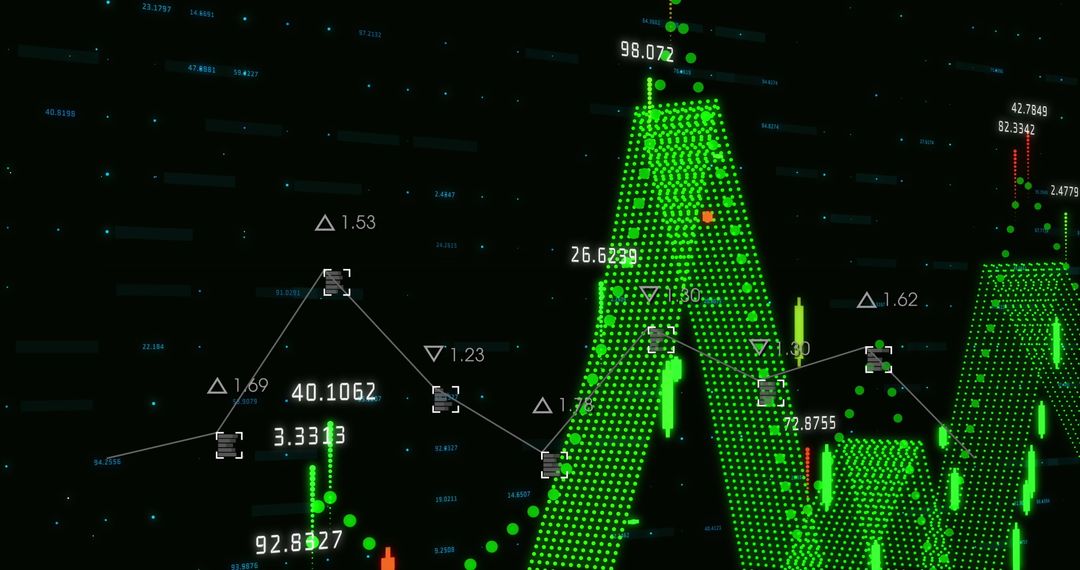
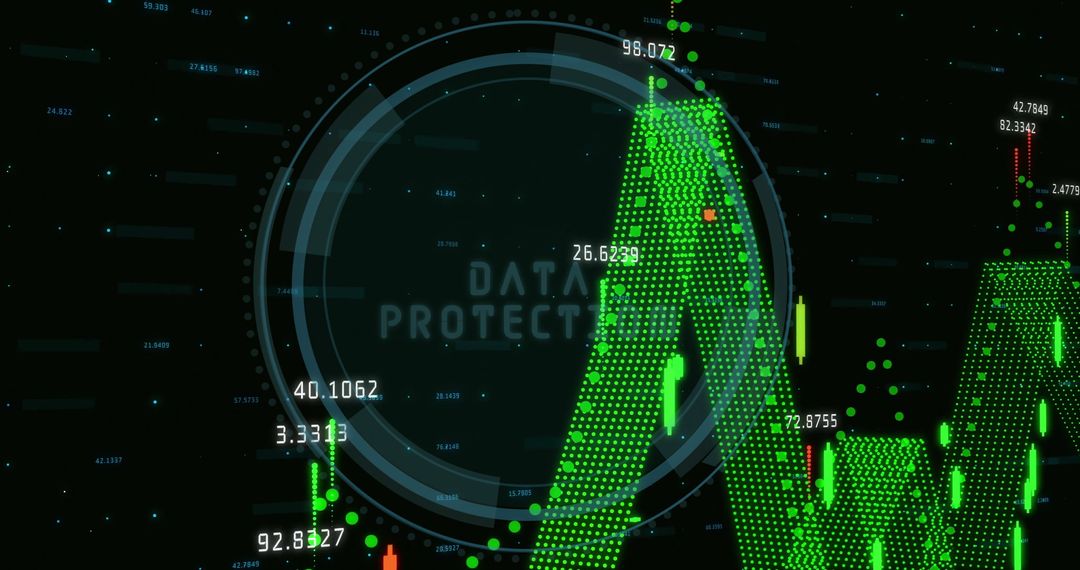
- Displaying Neon 3D Dotted Financial Chart with Candlesticks, Numeric Labels, Analytics
Displaying Neon 3D Dotted Financial Chart with Candlesticks, Numeric Labels, Analytics Image

Featuring neon green 3D dotted financial chart on dark background with candlestick markers, red highlight points, and floating numeric labels conveying market values and trends. Ideal for fintech branding, trading platform dashboards, investment research presentations, financial news headers, and data analytics marketing. Use as hero banner, slide deck background, social media graphic, UI mockup, or video intro to communicate high-tech, data-driven messaging. Provides ample negative space for overlaying headlines, KPI callouts, or company logos while maintaining futuristic neon aesthetic. Color palette and dimensional elements supporting concepts like algorithmic trading, market analysis, blockchain, and predictive analytics.
Powered by  - Get 15% off with code: PIKWIZARD15


0
downloads
downloads
Tags:
More
Credit Photo
If you would like to credit the Photo, here are some ways you can do so
Text Link
photo Link
<span class="text-link">
<span>
<a target="_blank" href=https://pikwizard.com/photo/displaying-neon-3d-dotted-financial-chart-with-candlesticks-numeric-labels-analytics/499913c35583112521723cdc9385fe27/>PikWizard</a>
</span>
</span>
<span class="image-link">
<span
style="margin: 0 0 20px 0; display: inline-block; vertical-align: middle; width: 100%;"
>
<a
target="_blank"
href="https://pikwizard.com/photo/displaying-neon-3d-dotted-financial-chart-with-candlesticks-numeric-labels-analytics/499913c35583112521723cdc9385fe27/"
style="text-decoration: none; font-size: 10px; margin: 0;"
>
<img src="https://pikwizard.com/pw/medium/499913c35583112521723cdc9385fe27.jpg" style="margin: 0; width: 100%;" alt="" />
<p style="font-size: 12px; margin: 0;">PikWizard</p>
</a>
</span>
</span>
Free (free of charge)
Free for personal and commercial use.
Author: Creative Art
Similar Free Stock Images

Premium


Premium


Premium


Premium


Premium


Premium


Premium


Premium


Premium


Premium


Premium


Premium


Premium


Premium


Premium


Premium


Premium


Premium


Premium


Premium


Premium


Premium


Premium


Premium