
- Home >
- Free Stock Photos & Images >
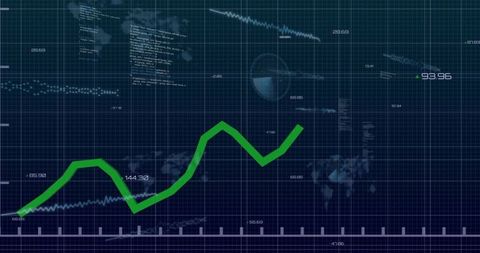
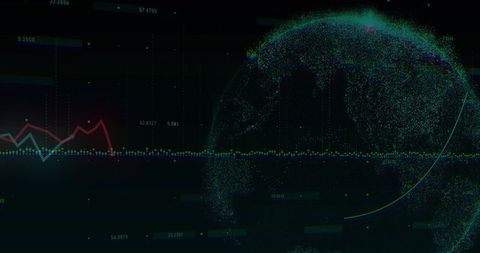
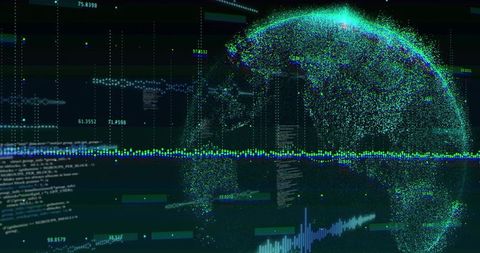
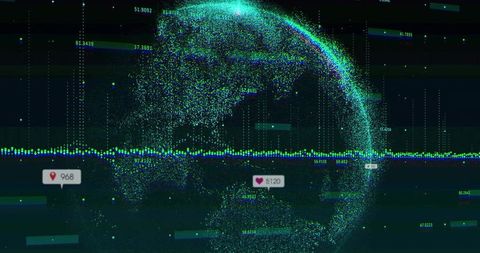
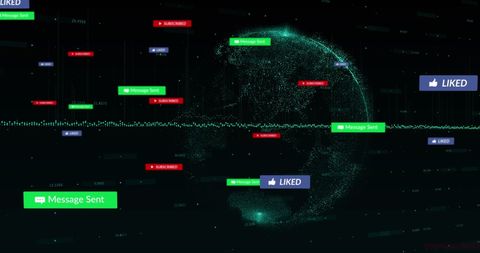
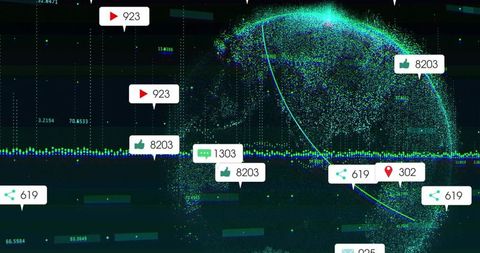
- Displaying neon analytics dashboard with particle globe, numeric counters and grid UI
Displaying neon analytics dashboard with particle globe, numeric counters and grid UI Free Stock Image
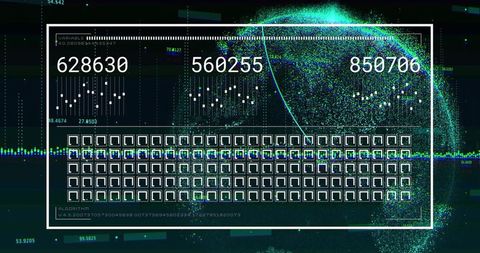
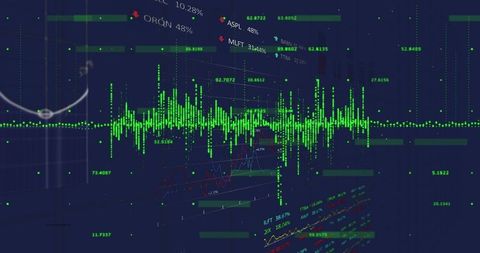
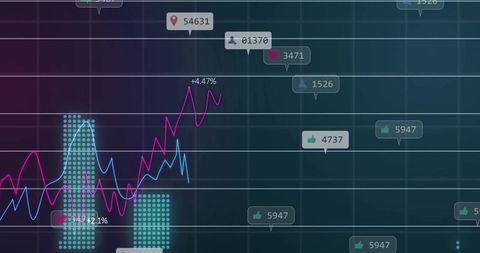
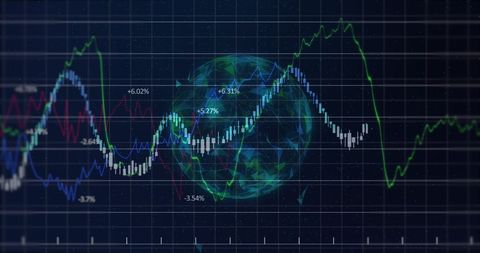
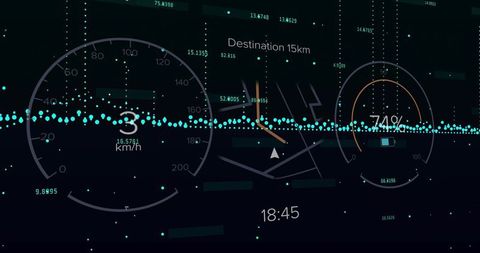
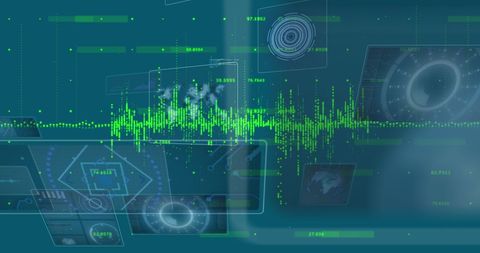
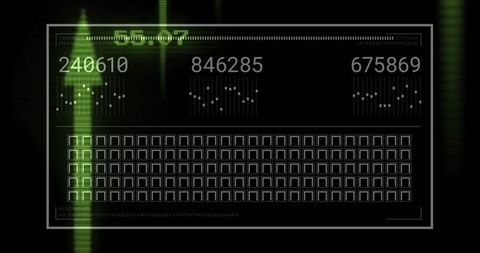
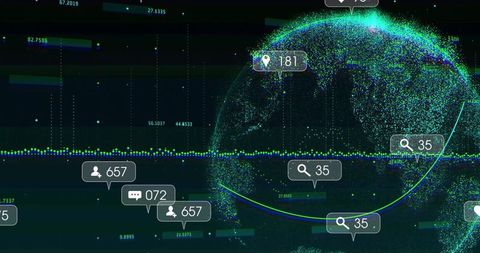
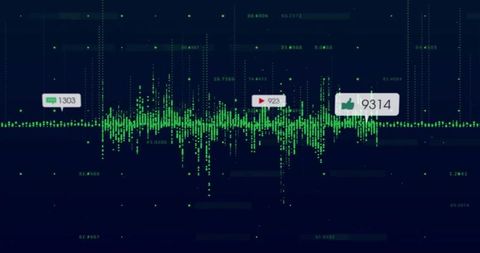
Dark neon visual showing three large numeric counters above compact grid of square modules, small candlestick-style charts and horizontal waveform band. Particle globe of green-blue points swirling behind dashboard, creating sense of depth and continuous data flow. High-contrast neon green and cyan on deep navy background creating futuristic tech mood and digital aesthetic. Serving to illustrate concepts like real-time analytics, big data processing, AI monitoring, finance dashboards, cybersecurity reporting, algorithm performance and user interface design. Suggested uses: hero header for tech websites, background for slides in investor pitches, mockup for dashboard UI presentations, overlay for motion graphics and video, editorial art for articles about data science and machine learning. Cropping suggestion: preserve full white frame and particle globe for dramatic composition; tight crop on numeric counters for banner use. Horizontal orientation fitting widescreen layouts and high-resolution sources supporting large prints and digital banners.
Powered by  - Get 15% off with code: PIKWIZARD15


downloads
Tags:
More
Credit Photo
If you would like to credit the Photo, here are some ways you can do so
Text Link
photo Link
<span class="text-link">
<span>
<a target="_blank" href=https://pikwizard.com/photo/displaying-neon-analytics-dashboard-with-particle-globe-numeric-counters-and-grid-ui/ae6e1f8dcdd071a27acbb48839ab3b88/>PikWizard</a>
</span>
</span>
<span class="image-link">
<span
style="margin: 0 0 20px 0; display: inline-block; vertical-align: middle; width: 100%;"
>
<a
target="_blank"
href="https://pikwizard.com/photo/displaying-neon-analytics-dashboard-with-particle-globe-numeric-counters-and-grid-ui/ae6e1f8dcdd071a27acbb48839ab3b88/"
style="text-decoration: none; font-size: 10px; margin: 0;"
>
<img src="https://thumbs.wbm.im/pw/medium/ae6e1f8dcdd071a27acbb48839ab3b88.jpg" style="margin: 0; width: 100%;" alt="Displaying neon analytics dashboard with particle globe, numeric counters and grid UI" />
<p style="font-size: 12px; margin: 0;">PikWizard</p>
</a>
</span>
</span>
Free (free of charge)
Free for personal and commercial use.
Author: Creative Art
Similar Free Stock Images


Premium


Premium


Premium


Premium


Premium


Premium


Premium


Premium


Premium


Premium


Premium


Premium


Premium


Premium


Premium


Premium


Premium


Premium


Premium


Premium


Premium


Premium

Premium


Premium


Premium

Explore More Free Stock Images