- Home >
- Stock Photos >
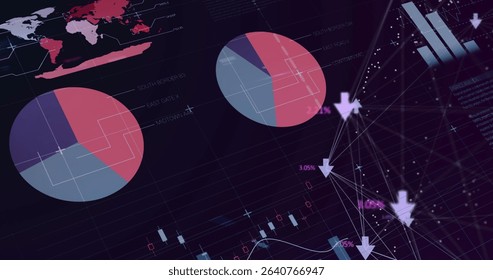
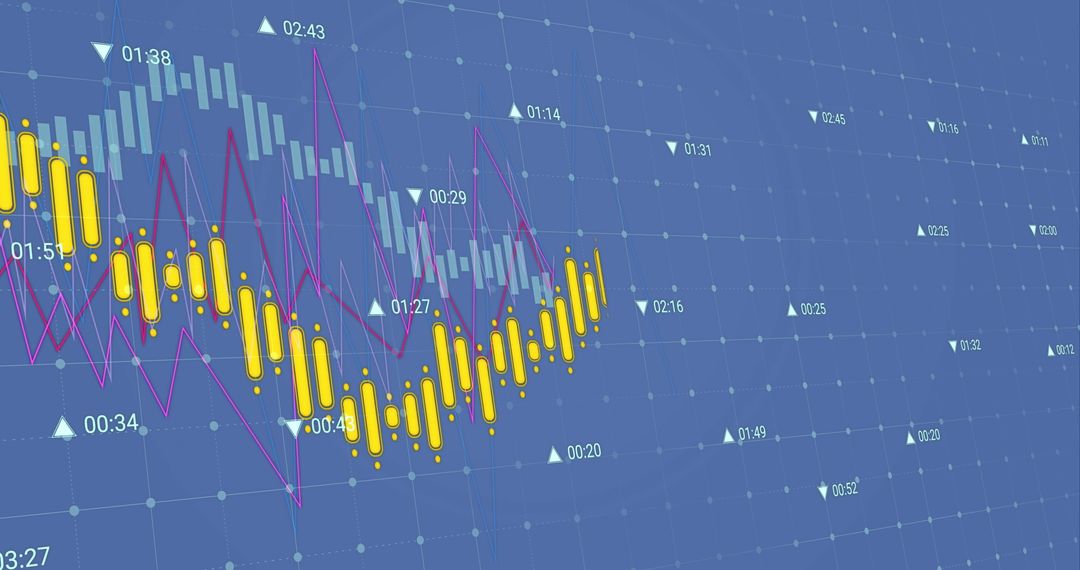
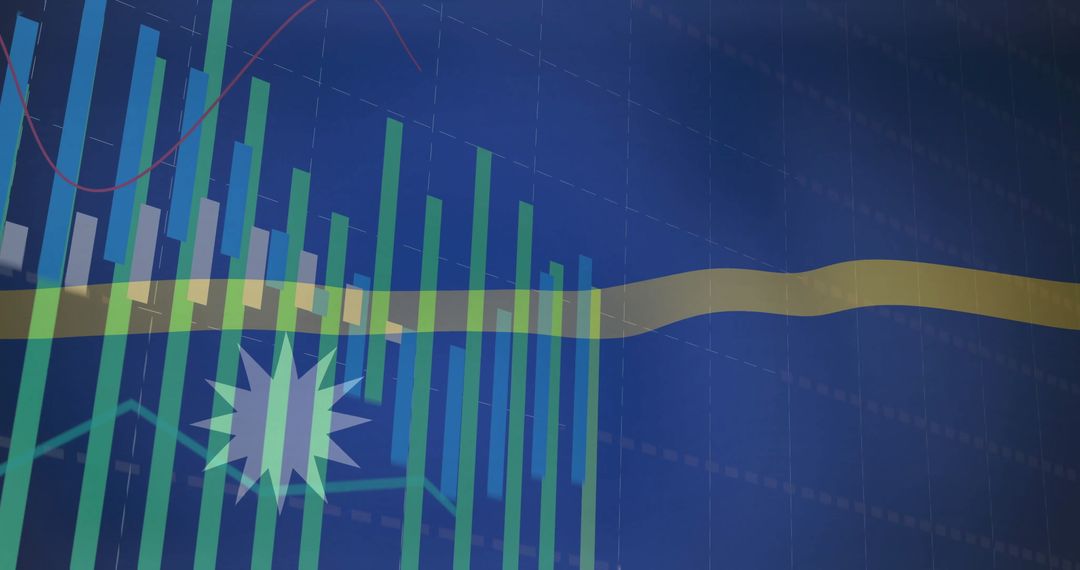
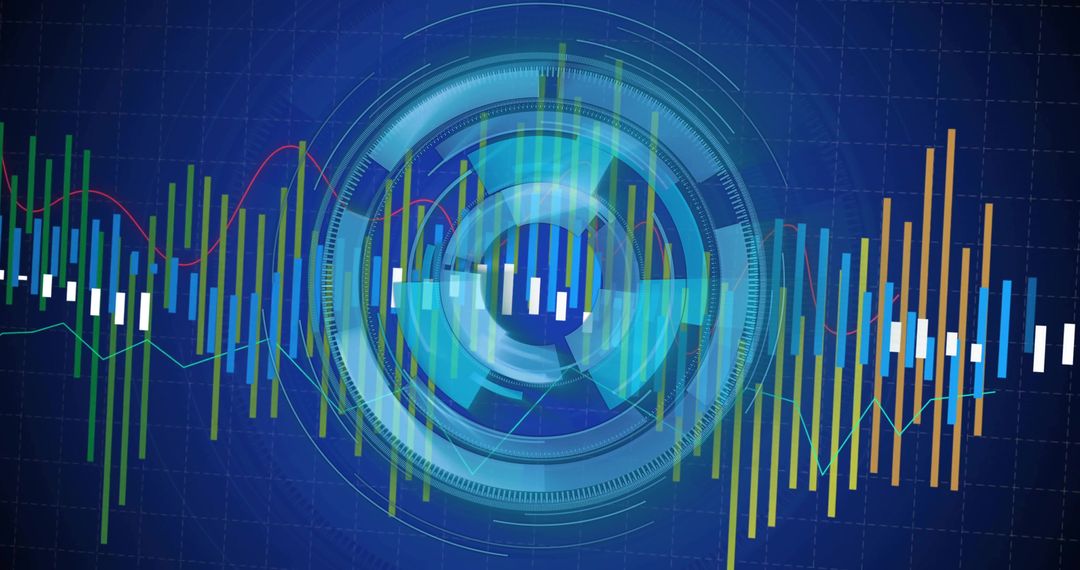
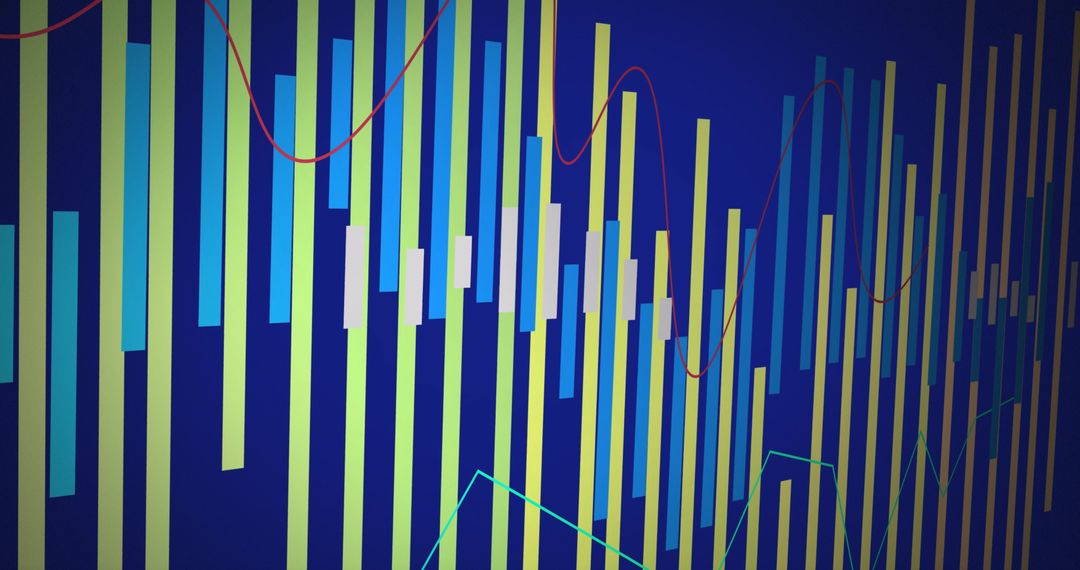
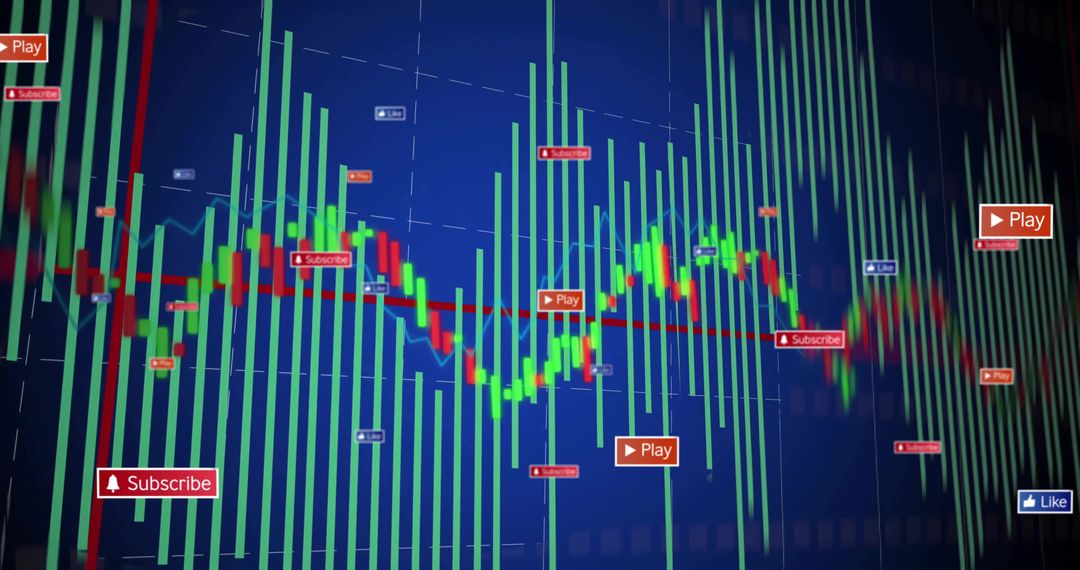
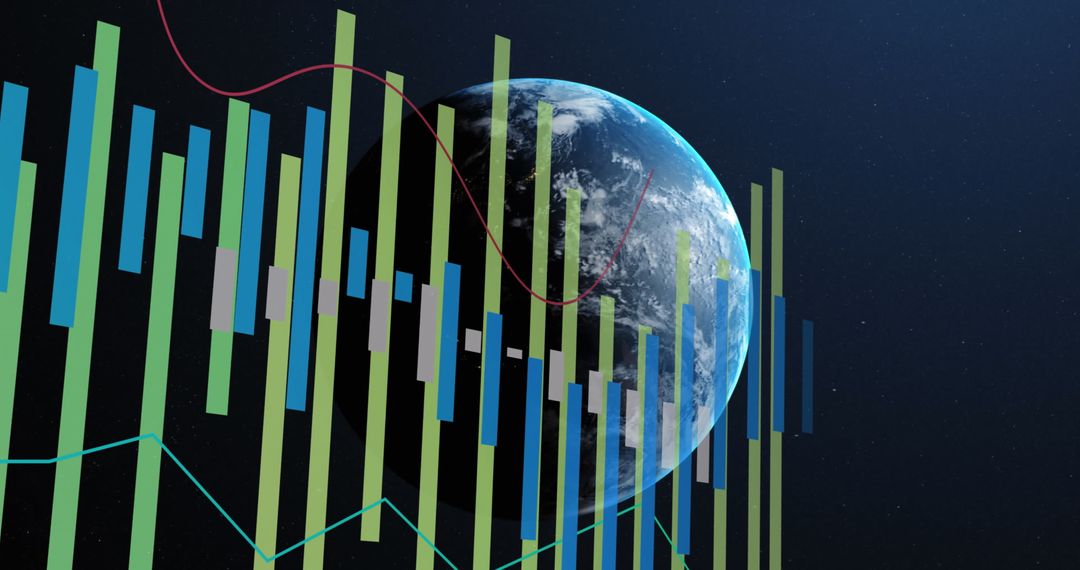
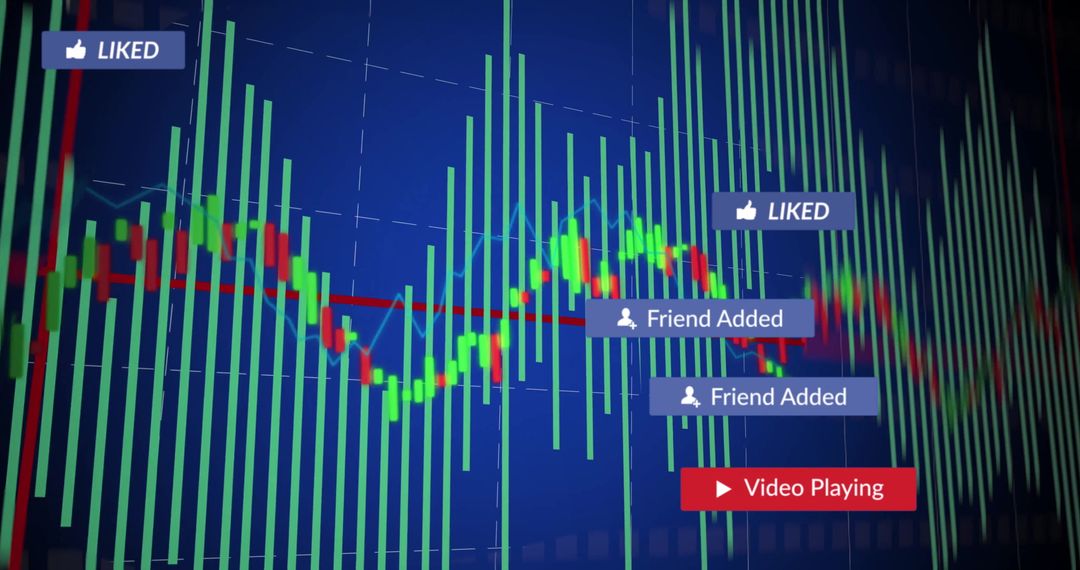
- Displaying Neon Financial Candlestick and Bar Dashboard with Line Graphs and Halftone Grid
Displaying Neon Financial Candlestick and Bar Dashboard with Line Graphs and Halftone Grid Image

High-contrast neon blue visualization showing vertical candlestick bars, colored bar segments, and trend lines over halftone grid. Strong abstract composition suiting fintech, stock market, trading platform, data analytics presentation. Serving as website hero banner, app onboarding screen, investor report cover, financial blog header, social media post, corporate presentation. Helping convey growth, volatility, performance metrics, real-time analytics. Offering color palette with neon green, cyan, deep blue for modern tech mood. Providing crop-friendly layout with central vertical elements and negative space at edges for overlaying text or logos.
Powered by  - Get 15% off with code: PIKWIZARD15


0
downloads
downloads
Tags:
More
Credit Photo
If you would like to credit the Photo, here are some ways you can do so
Text Link
photo Link
<span class="text-link">
<span>
<a target="_blank" href=https://pikwizard.com/photo/displaying-neon-financial-candlestick-and-bar-dashboard-with-line-graphs-and-halftone-grid/b1aa3904e6b11247c50421e2bc29f61b/>PikWizard</a>
</span>
</span>
<span class="image-link">
<span
style="margin: 0 0 20px 0; display: inline-block; vertical-align: middle; width: 100%;"
>
<a
target="_blank"
href="https://pikwizard.com/photo/displaying-neon-financial-candlestick-and-bar-dashboard-with-line-graphs-and-halftone-grid/b1aa3904e6b11247c50421e2bc29f61b/"
style="text-decoration: none; font-size: 10px; margin: 0;"
>
<img src="https://pikwizard.com/pw/medium/b1aa3904e6b11247c50421e2bc29f61b.jpg" style="margin: 0; width: 100%;" alt="" />
<p style="font-size: 12px; margin: 0;">PikWizard</p>
</a>
</span>
</span>
Free (free of charge)
Free for personal and commercial use.
Author: People Creations
Similar Free Stock Images

Premium


Premium


Premium


Premium


Premium


Premium


Premium


Premium


Premium


Premium


Premium


Premium


Premium


Premium


Premium


Premium


Premium


Premium


Premium


Premium


Premium


Premium


Premium


Premium