
- Home >
- Stock Photos >
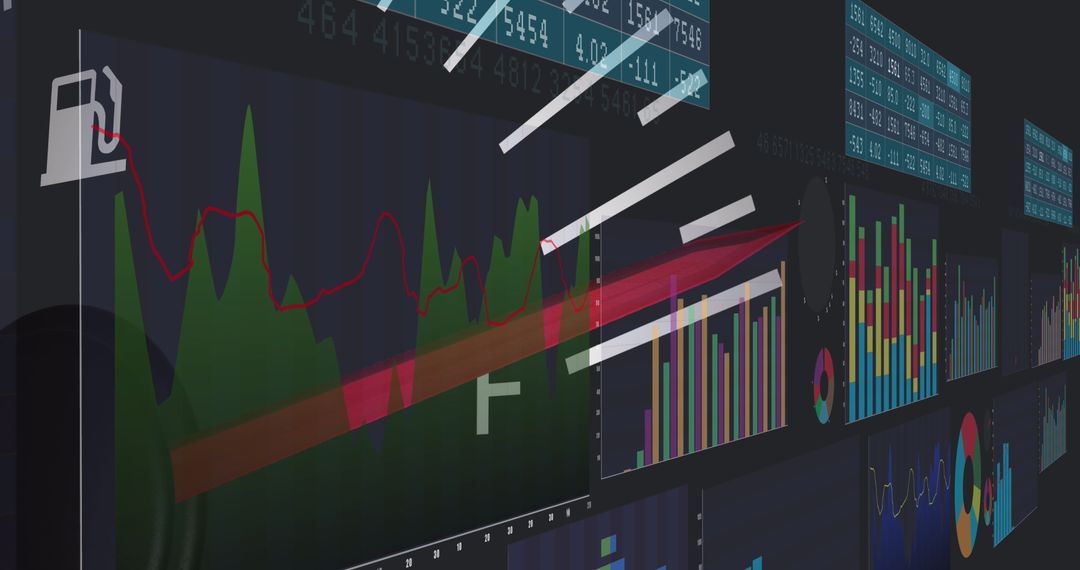
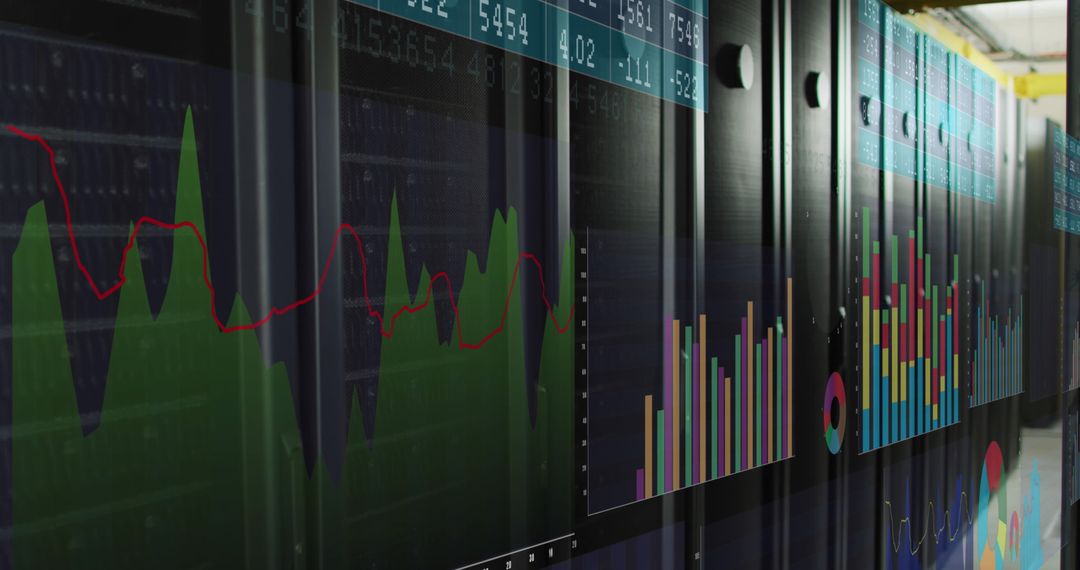
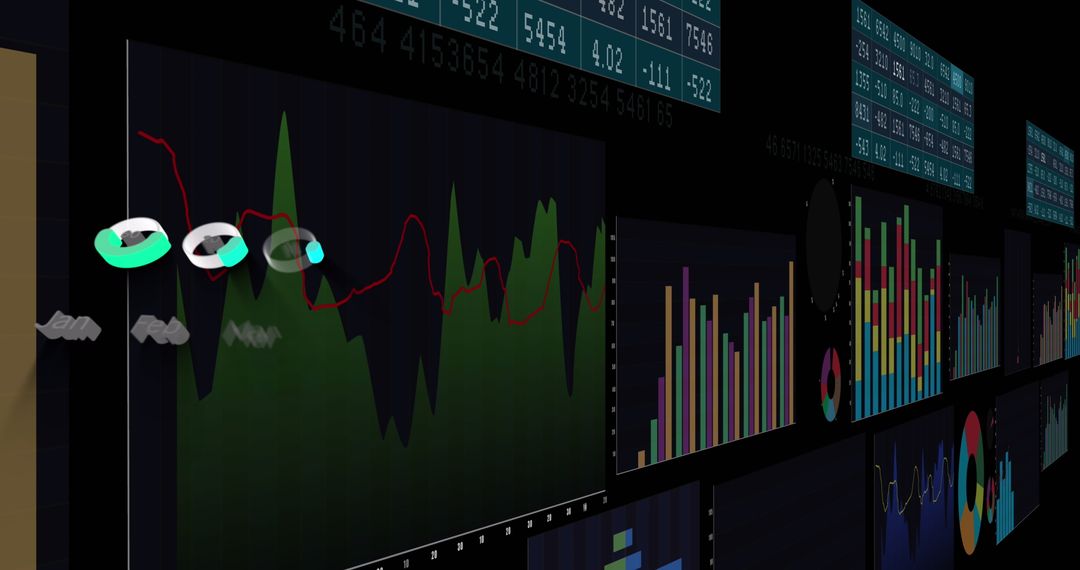
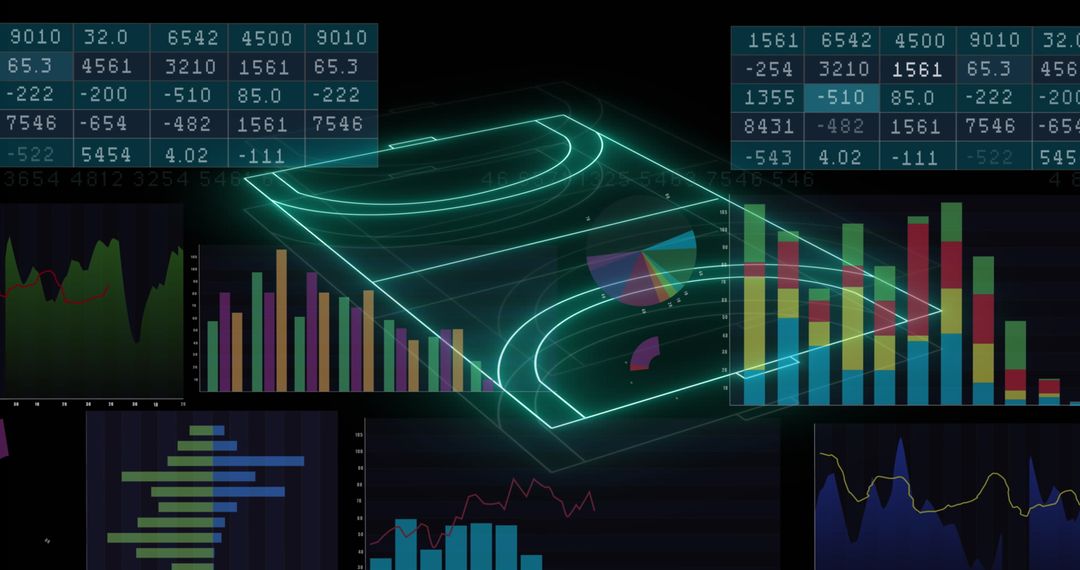
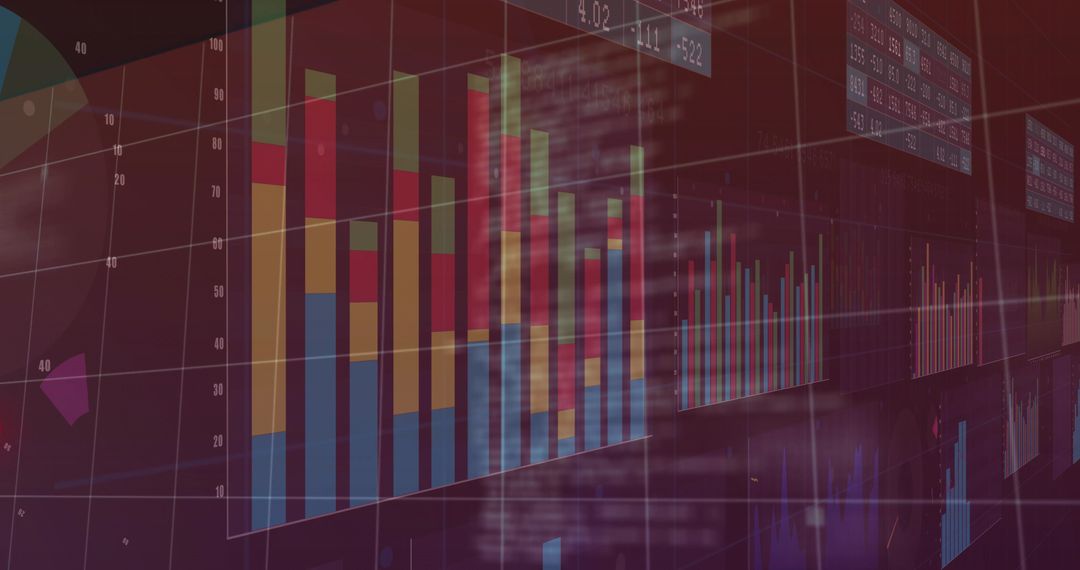
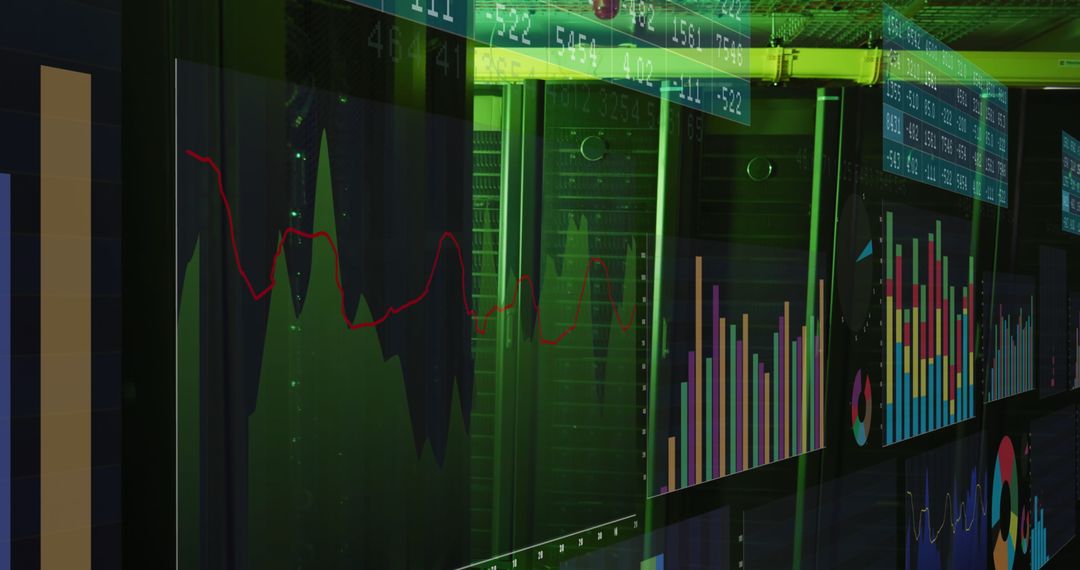
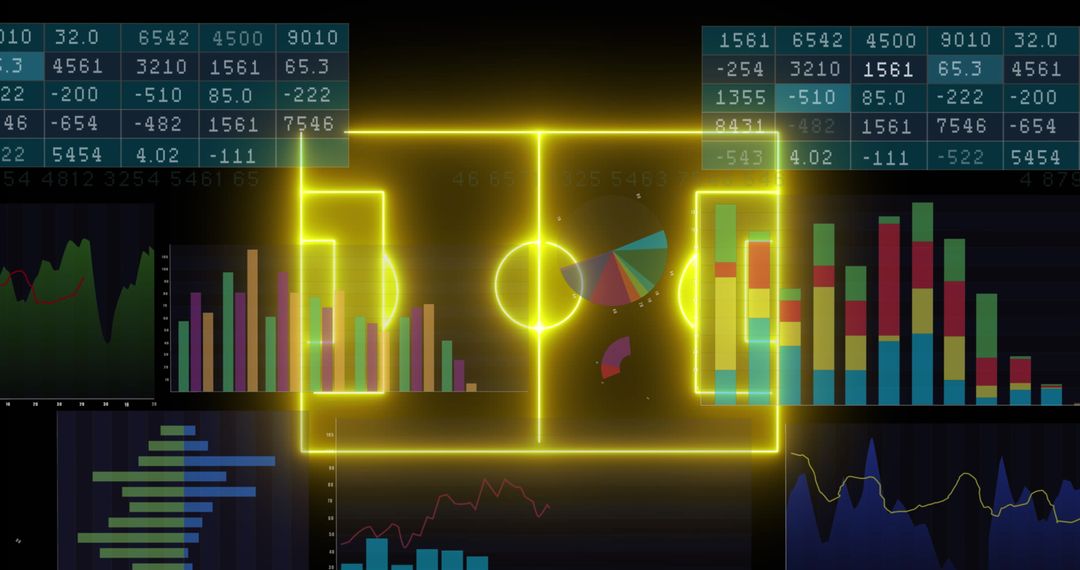
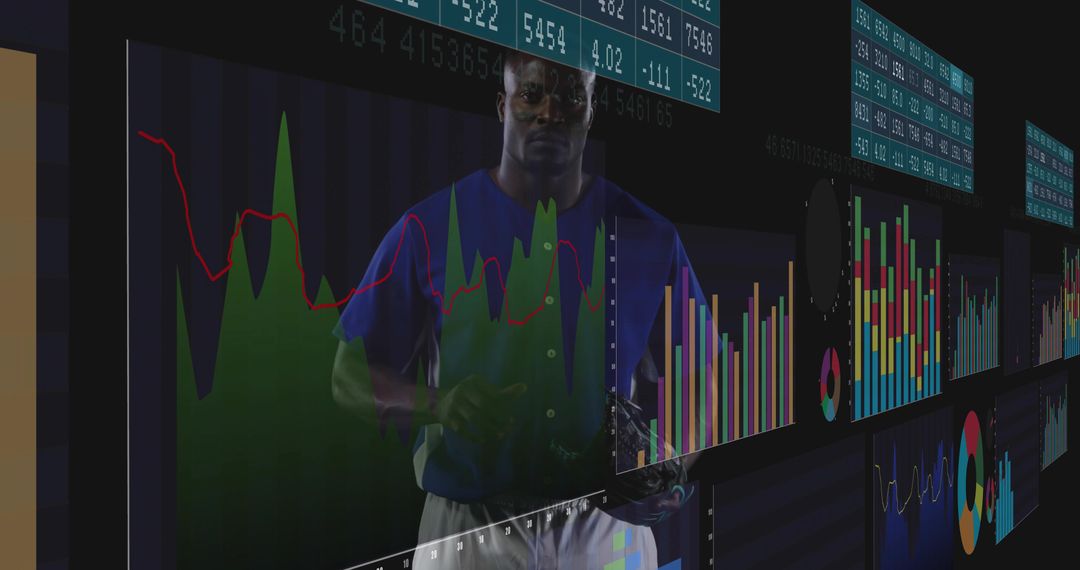
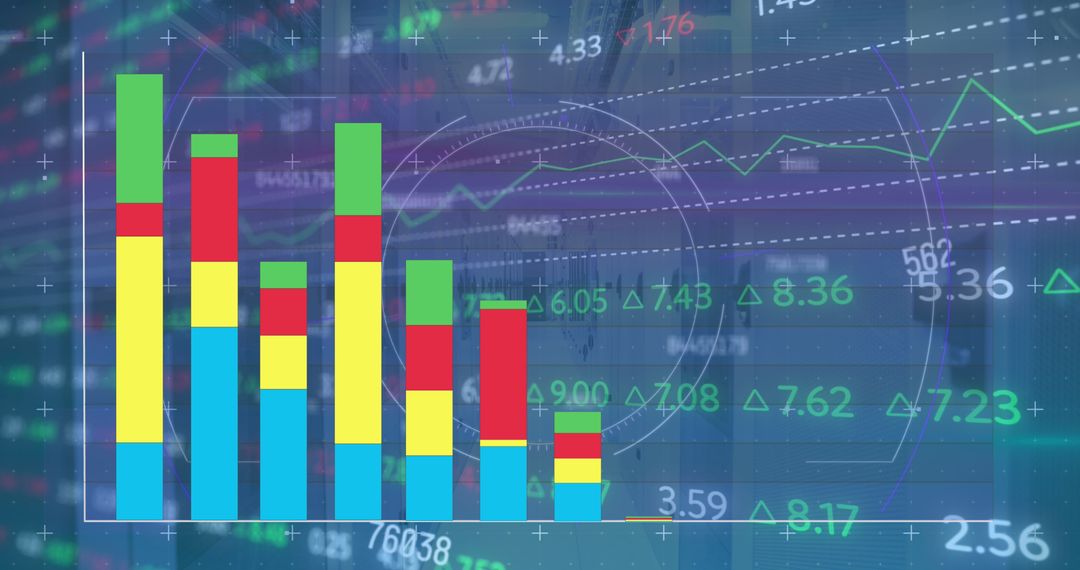
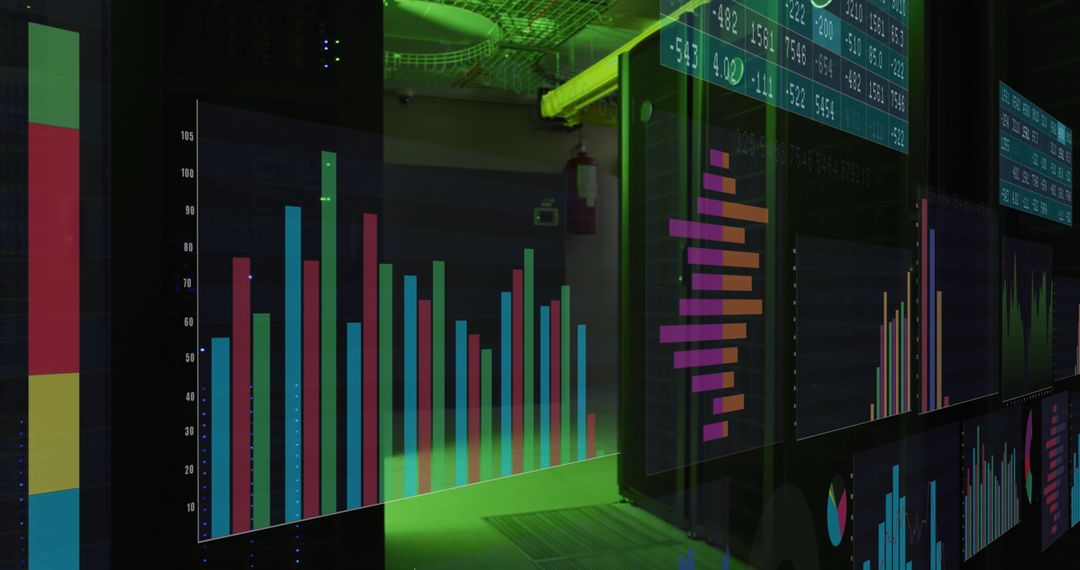
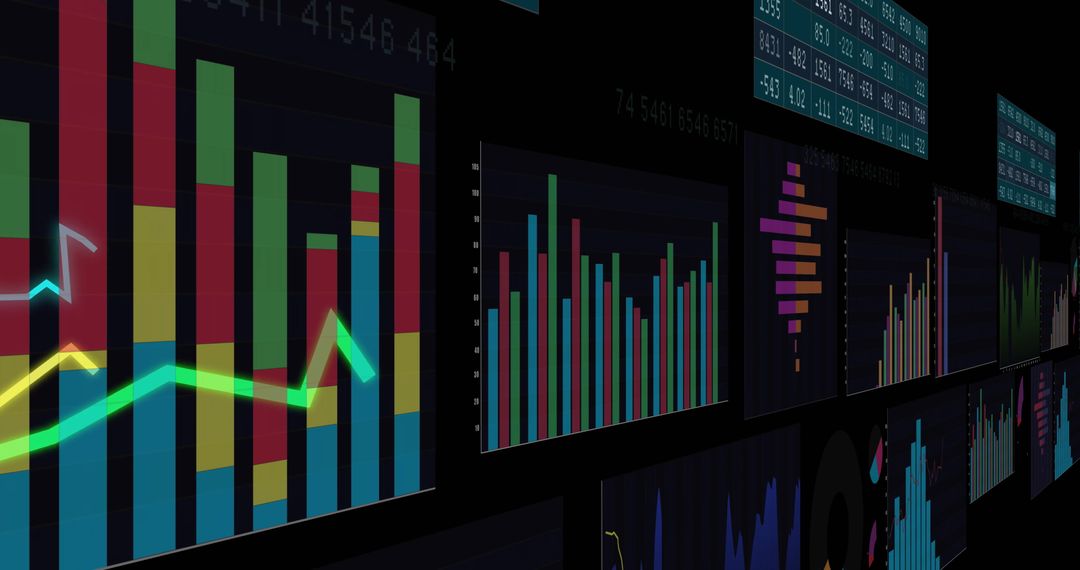
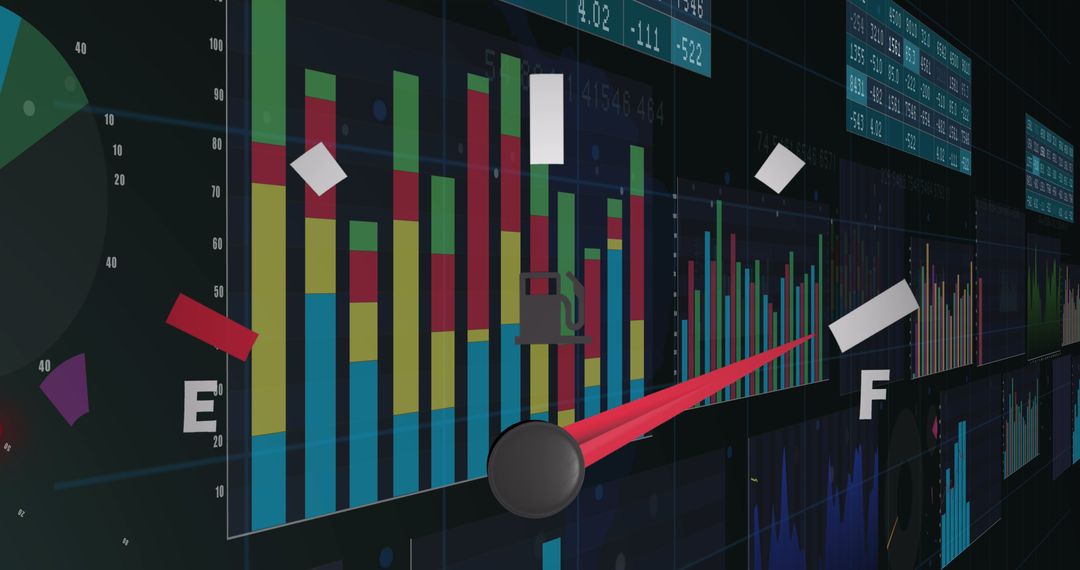
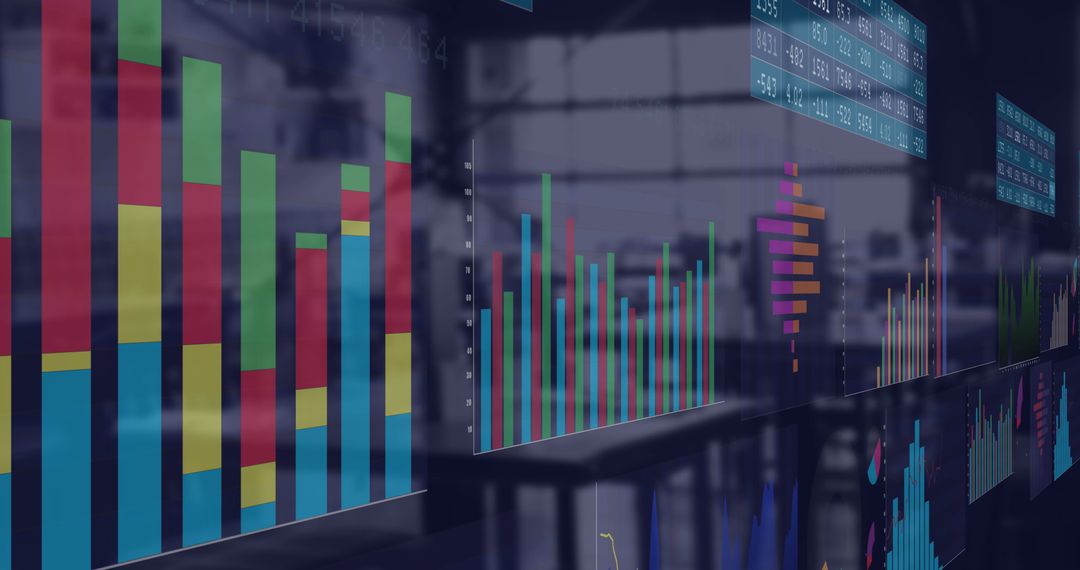
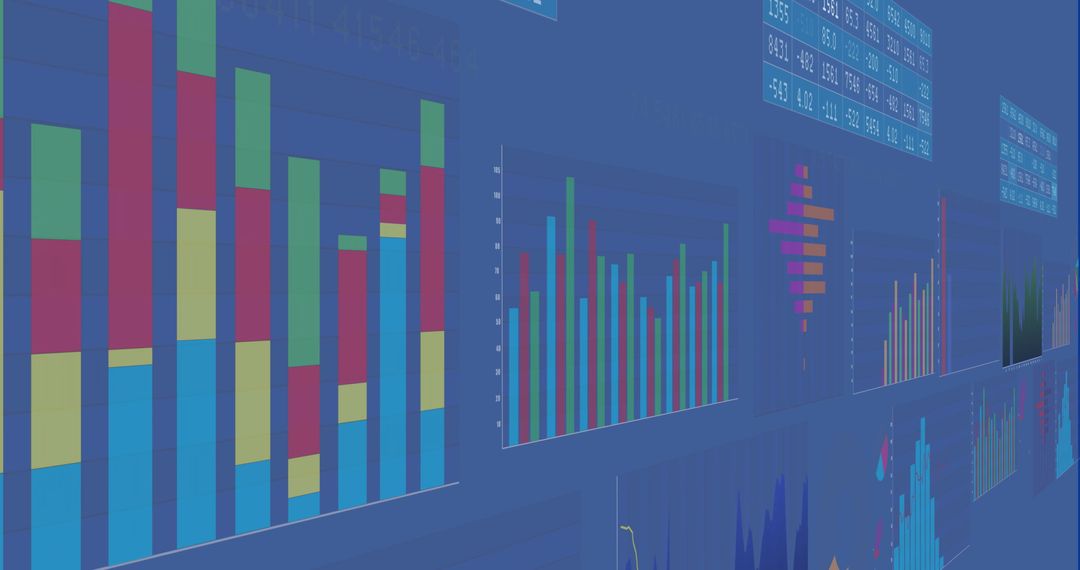
- Displaying Neon Stacked Bar Chart Dashboard on Dark Analytics Wall for Metrics
Displaying Neon Stacked Bar Chart Dashboard on Dark Analytics Wall for Metrics Image

Displaying large stacked bar chart panel across dark analytics wall, showing partial pie at left and rows of smaller charts receding into depth. Neon color bands and numeric tick marks creating high-contrast modern look for tech and finance themes. Strong perspective and grid layout conveying scale of monitoring and real-time metrics. Ideal for dashboard design presentations, business intelligence marketing, website hero banners, blog headers, pitch decks, investor reports, online courses on data analysis. Crop options for close-up on stacked bars or wide-angle view encompassing entire analytics wall; space on right allowing headline and KPI overlay. Use for finance, marketing, operations, data science, cybersecurity, SaaS, IoT, enterprise reporting. Color palette featuring neon cyan, magenta, lime and deep blue on charcoal background; recommended for conveying futuristic, high-tech atmosphere.
Powered by 


0
downloads
downloads
Tags:
More
Credit Photo
If you would like to credit the Photo, here are some ways you can do so
Text Link
photo Link
<span class="text-link">
<span>
<a target="_blank" href=https://pikwizard.com/photo/displaying-neon-stacked-bar-chart-dashboard-on-dark-analytics-wall-for-metrics/97fbfb61625c0b6b535a98b3e8f5e6e5/>PikWizard</a>
</span>
</span>
<span class="image-link">
<span
style="margin: 0 0 20px 0; display: inline-block; vertical-align: middle; width: 100%;"
>
<a
target="_blank"
href="https://pikwizard.com/photo/displaying-neon-stacked-bar-chart-dashboard-on-dark-analytics-wall-for-metrics/97fbfb61625c0b6b535a98b3e8f5e6e5/"
style="text-decoration: none; font-size: 10px; margin: 0;"
>
<img src="https://pikwizard.com/pw/medium/97fbfb61625c0b6b535a98b3e8f5e6e5.jpg" style="margin: 0; width: 100%;" alt="" />
<p style="font-size: 12px; margin: 0;">PikWizard</p>
</a>
</span>
</span>
Free (free of charge)
Free for personal and commercial use.
Author: Authentic Images
Similar Free Stock Images
Premium


Premium


Premium


Premium


Premium


Premium


Premium


Premium


Premium

Premium


Premium


Premium


Premium

Premium


Premium


Premium


Premium


Premium


Premium


Premium


Premium


Premium


Premium


Premium

