- Home >
- Stock Photos >
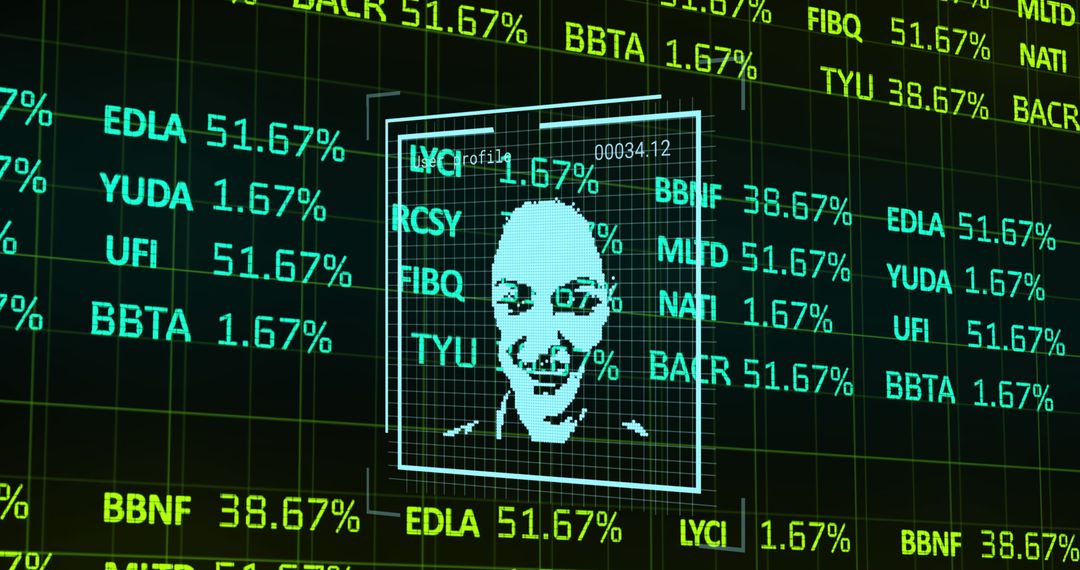
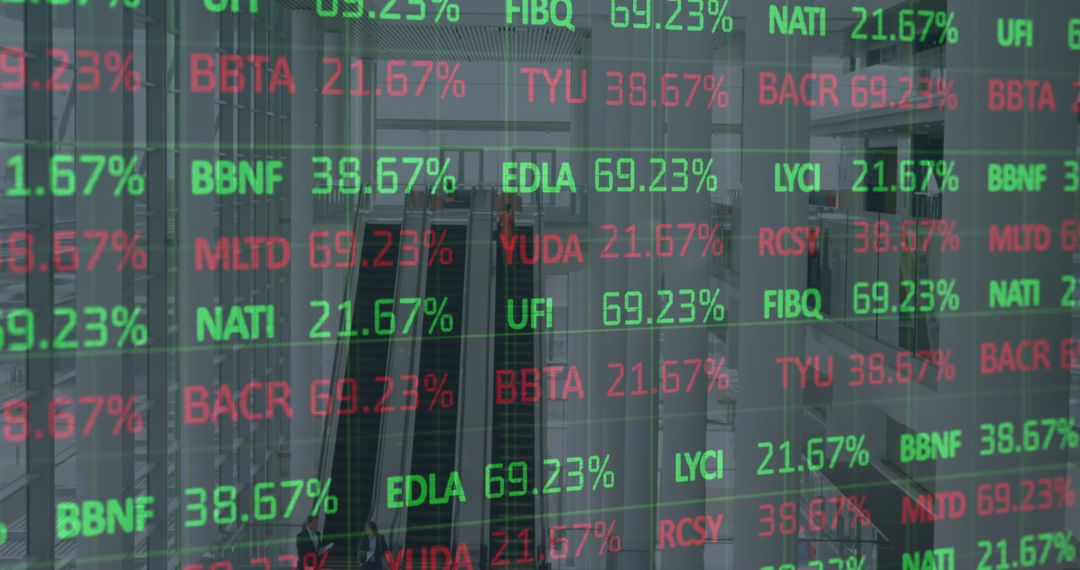
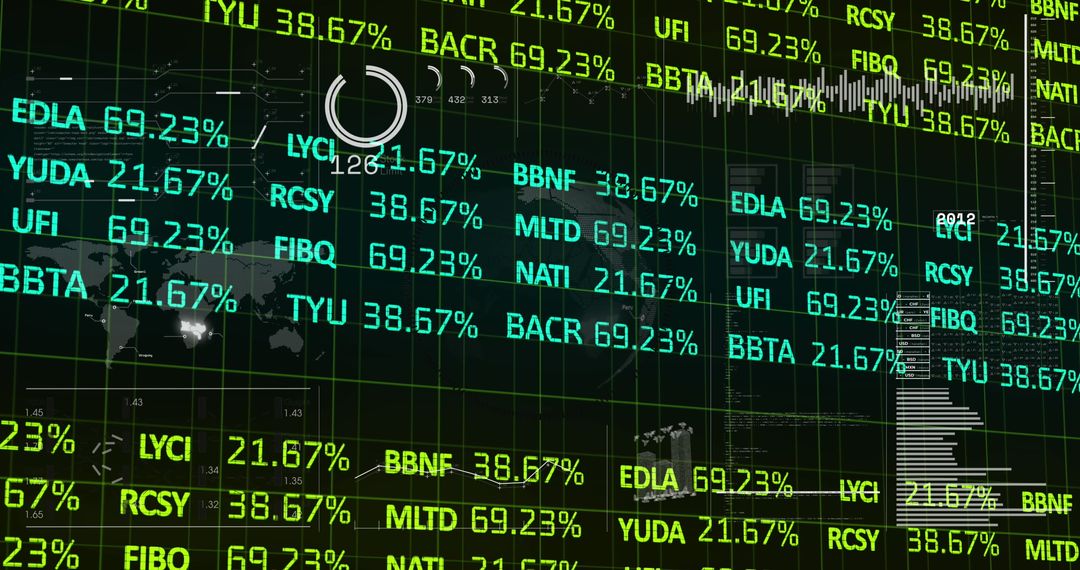
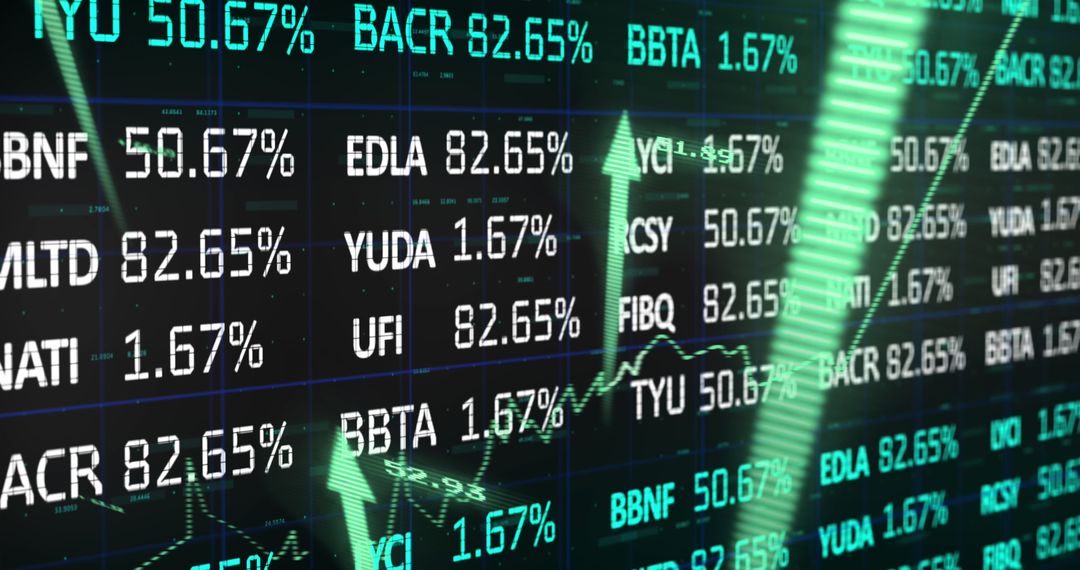
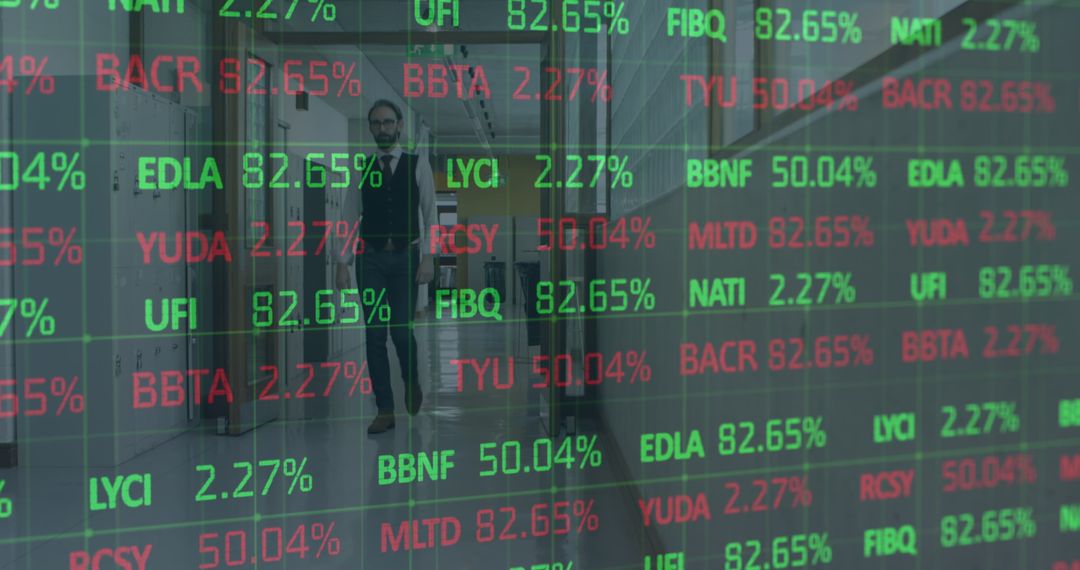
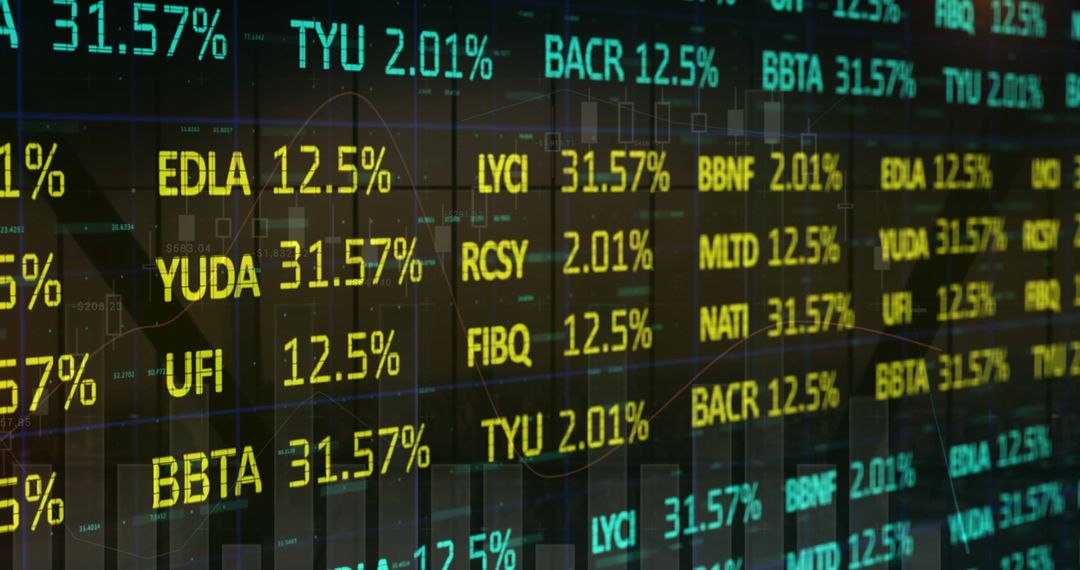
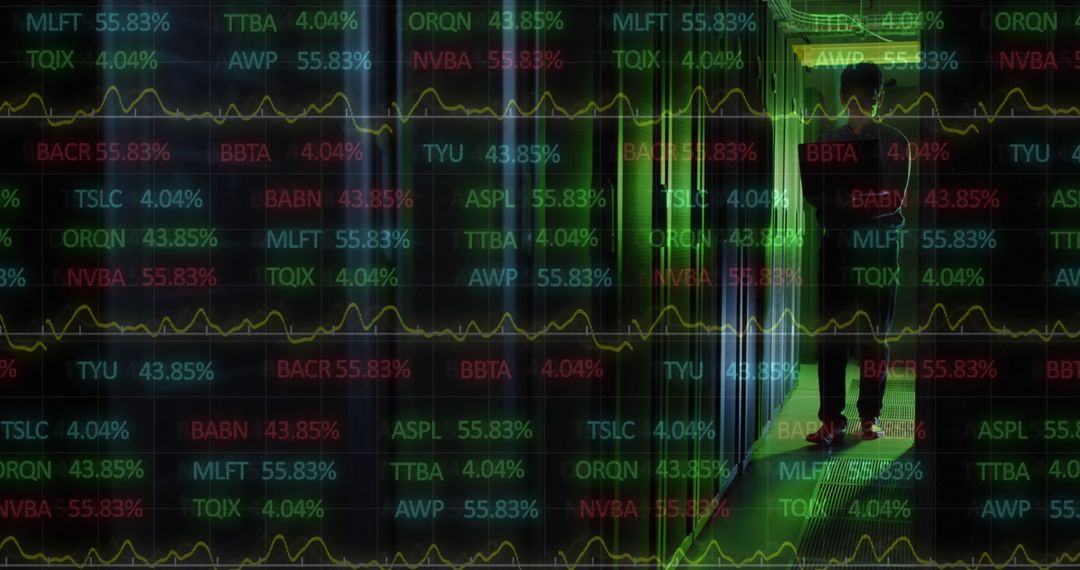
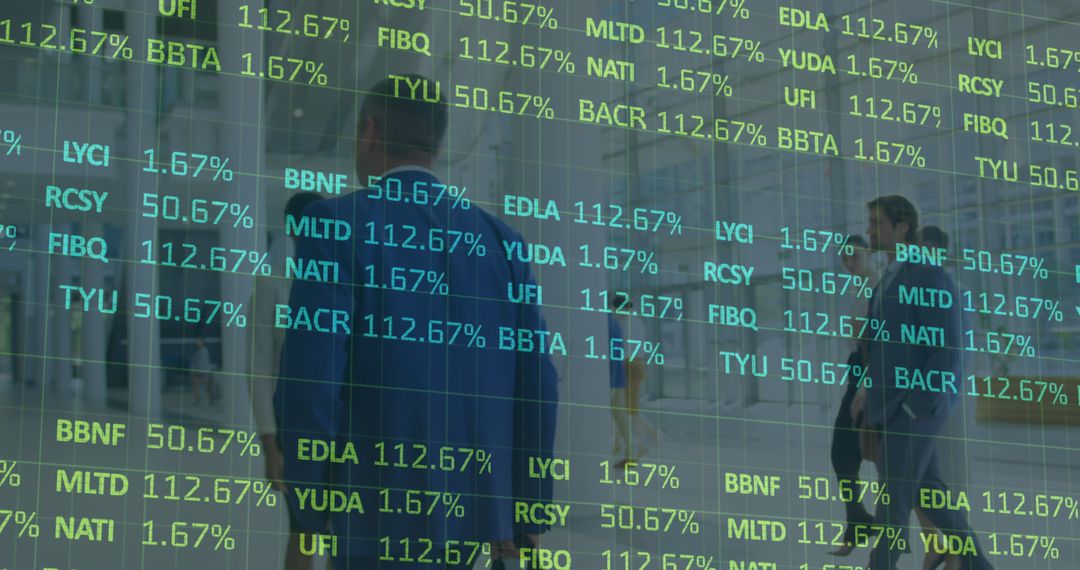
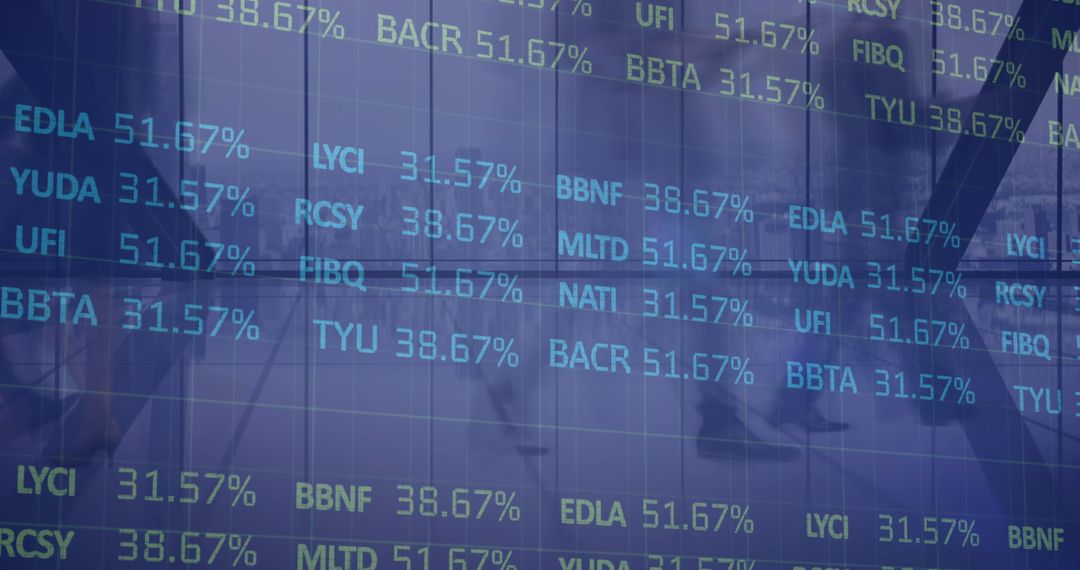
- Displaying semi-opaque digital stock ticker overlay on urban skyscraper window with neon percentages
Displaying semi-opaque digital stock ticker overlay on urban skyscraper window with neon percentages Image
Showing semi-opaque digital ticker overlaying glass facade of urban skyscraper, listing ticker symbols and percentage values in neon green and cyan. Reflecting city skyline and office interiors through glass for layered, data-driven composition. Conveying fast-paced financial atmosphere and high-tech trading environment, suggesting market movement and volatility. Suitable for financial websites, business presentations, market analysis reports, fintech app backgrounds, corporate annual reports, news articles about markets, advertising for trading platforms, social media posts about investing. Offering high-contrast neon-on-dark palette and grid lines for technical, futuristic look. Allowing easy cropping for banner and header use, replacing ticker values for custom messaging, overlaying brand logo in corner for branded marketing. Color palette: neon green, cyan, dark charcoal. Ideal for hero banner, slide deck cover, blog header, background for financial dashboards, newsroom graphics.
Powered by  - Get 15% off with code: PIKWIZARD15


0
downloads
downloads
Tags:
More
Credit Photo
If you would like to credit the Photo, here are some ways you can do so
Text Link
photo Link
<span class="text-link">
<span>
<a target="_blank" href=https://pikwizard.com/photo/displaying-semi-opaque-digital-stock-ticker-overlay-on-urban-skyscraper-window-with-neon-percentages/8e28da6e538908e35c7dae39f6d5b68c/>PikWizard</a>
</span>
</span>
<span class="image-link">
<span
style="margin: 0 0 20px 0; display: inline-block; vertical-align: middle; width: 100%;"
>
<a
target="_blank"
href="https://pikwizard.com/photo/displaying-semi-opaque-digital-stock-ticker-overlay-on-urban-skyscraper-window-with-neon-percentages/8e28da6e538908e35c7dae39f6d5b68c/"
style="text-decoration: none; font-size: 10px; margin: 0;"
>
<img src="https://pikwizard.com/pw/medium/8e28da6e538908e35c7dae39f6d5b68c.jpg" style="margin: 0; width: 100%;" alt="" />
<p style="font-size: 12px; margin: 0;">PikWizard</p>
</a>
</span>
</span>
Free (free of charge)
Free for personal and commercial use.
Author: Authentic Images
Similar Free Stock Images
Premium


Premium


Premium


Premium


Premium


Premium


Premium


Premium


Premium


Premium


Premium

Premium


Premium


Premium


Premium


Premium


Premium


Premium


Premium


Premium


Premium


Premium


Premium


Premium