
- Home >
- Stock Photos >
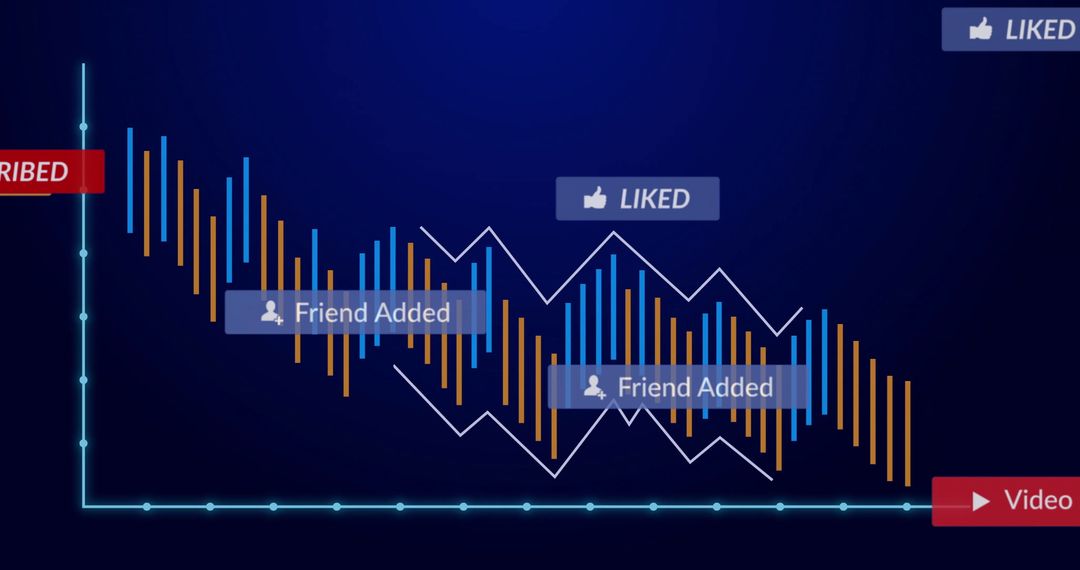
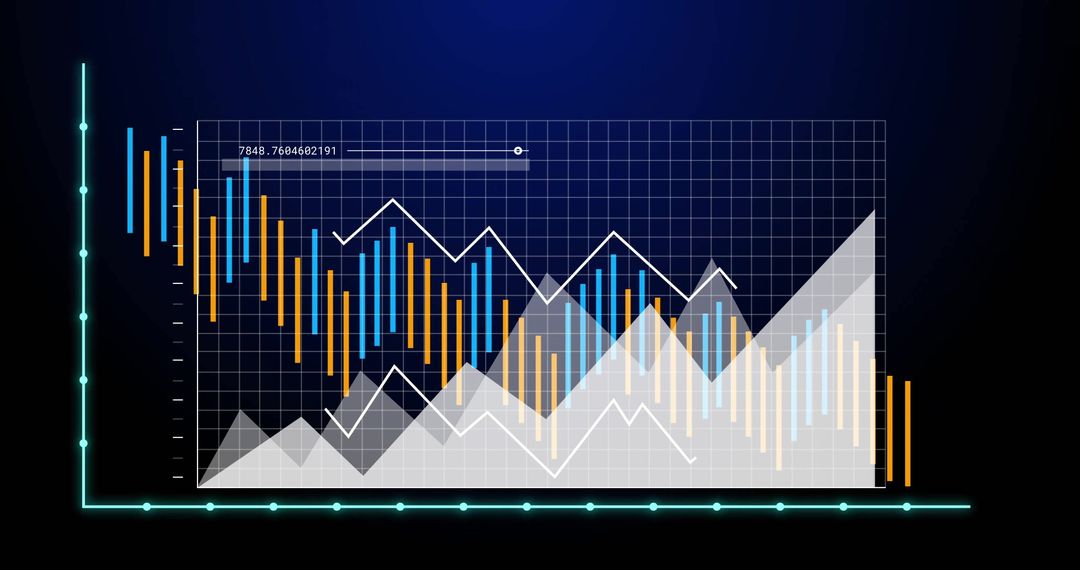
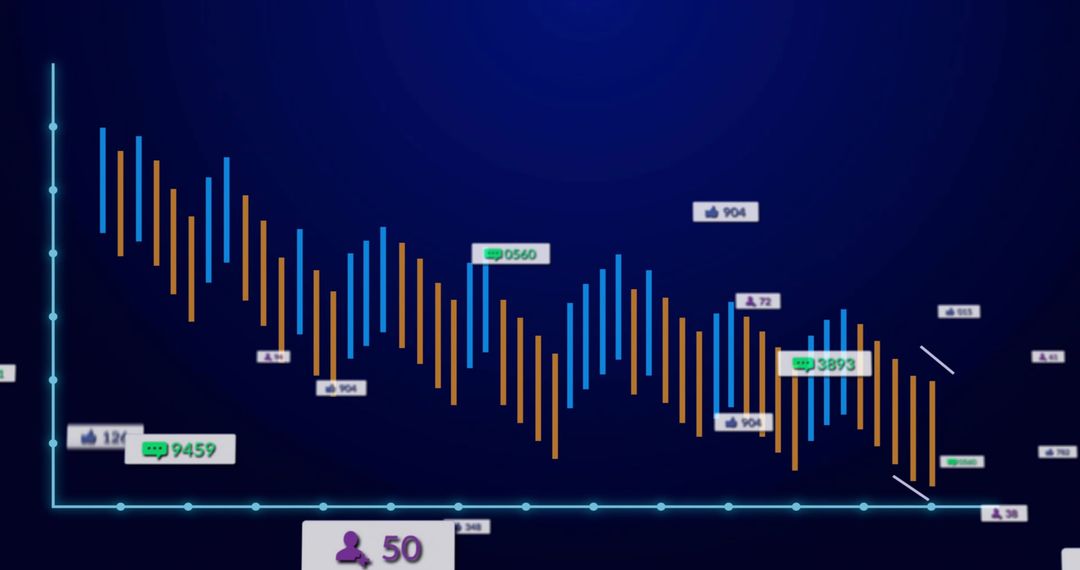
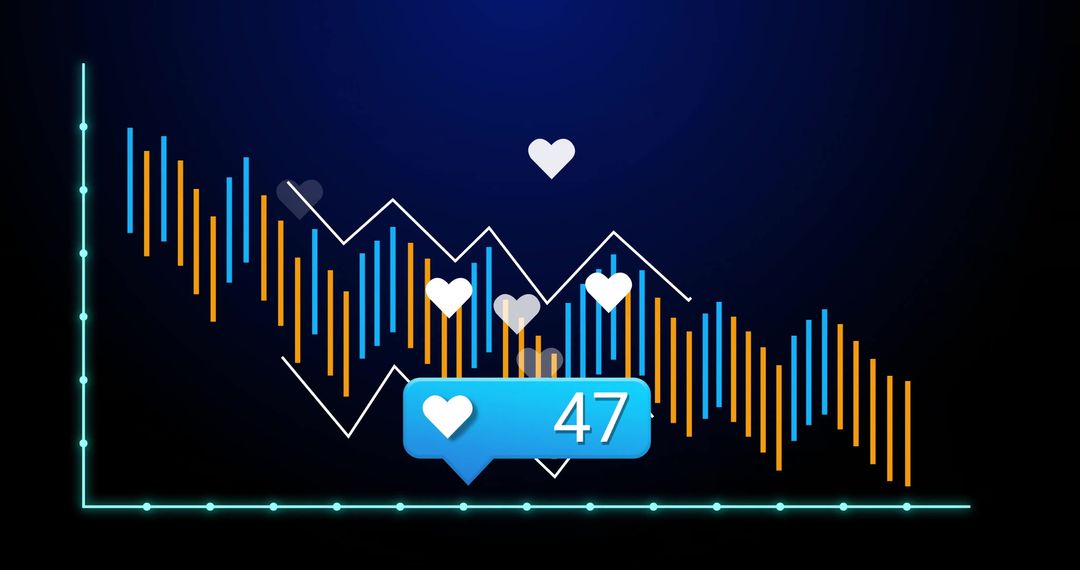
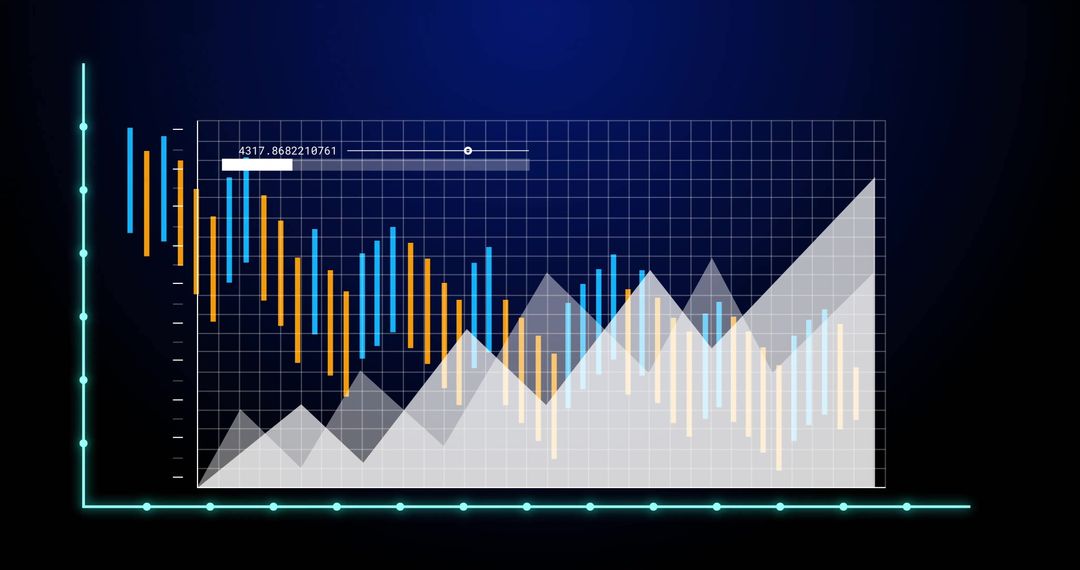
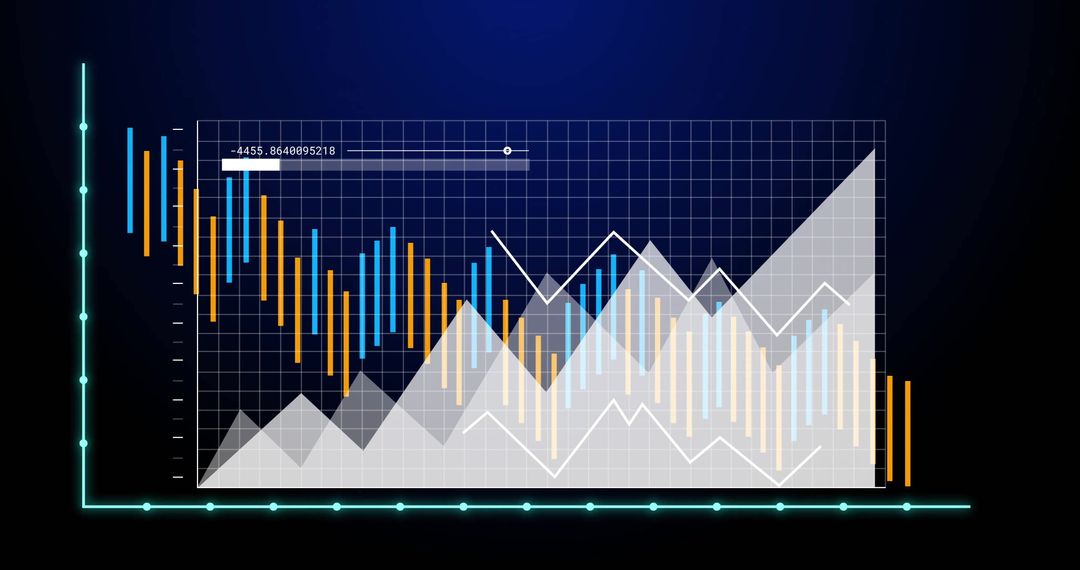
- Displaying Social Media Engagement Dashboard with Colorful Time-Series Bars and Tooltips
Displaying Social Media Engagement Dashboard with Colorful Time-Series Bars and Tooltips Image
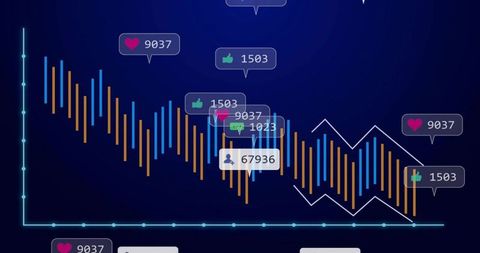
Presenting modern dashboard interface with alternating blue and orange vertical bars, white zigzag trend line, and social engagement tooltips showing likes and follower counts. Supporting marketers and analysts by visualizing engagement trends, comparing performance over time, and highlighting spikes in user interactions. Working well for presentations, reports, website hero sections, blog posts, marketing decks, and social media performance dashboards. Allowing simple customization of colors, overlay text, and annotations to match brand style; suiting use as slide visual, blog illustration, promotional banner, or app dashboard preview.
Powered by  - Get 15% off with code: PIKWIZARD15


0
downloads
downloads
Tags:
More
Credit Photo
If you would like to credit the Photo, here are some ways you can do so
Text Link
photo Link
<span class="text-link">
<span>
<a target="_blank" href=https://pikwizard.com/photo/displaying-social-media-engagement-dashboard-with-colorful-time-series-bars-and-tooltips/8275e85b2e1fee8c39feee25bb60e0c1/>PikWizard</a>
</span>
</span>
<span class="image-link">
<span
style="margin: 0 0 20px 0; display: inline-block; vertical-align: middle; width: 100%;"
>
<a
target="_blank"
href="https://pikwizard.com/photo/displaying-social-media-engagement-dashboard-with-colorful-time-series-bars-and-tooltips/8275e85b2e1fee8c39feee25bb60e0c1/"
style="text-decoration: none; font-size: 10px; margin: 0;"
>
<img src="https://pikwizard.com/pw/medium/8275e85b2e1fee8c39feee25bb60e0c1.jpg" style="margin: 0; width: 100%;" alt="" />
<p style="font-size: 12px; margin: 0;">PikWizard</p>
</a>
</span>
</span>
Free (free of charge)
Free for personal and commercial use.
Author: Awesome Content
Similar Free Stock Images

Premium


Premium


Premium


Premium


Premium


Premium


Premium


Premium


Premium


Premium


Premium


Premium


Premium


Premium


Premium


Premium


Premium


Premium


Premium


Premium


Premium


Premium


Premium


Premium

