
- Home >
- Stock Photos >
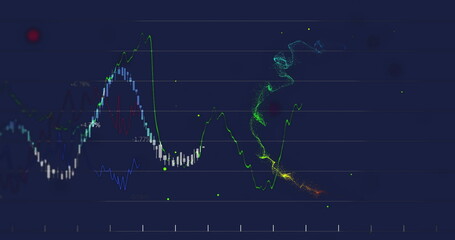
- Displaying Time-Series Analytics Waveform Over JavaScript Code with Futuristic Radar
Displaying Time-Series Analytics Waveform Over JavaScript Code with Futuristic Radar Image

Showing layered time-series waveform and vertical bar chart over JavaScript code and radar-style HUD on dark blue grid, conveying high-tech analytics and real-time monitoring. Combining data visualization and programming motifs for topics such as financial markets, algorithmic trading, signal processing, cybersecurity, and big data. Suiting technology presentations, fintech reports, dashboard UI mockups, blog headers, white papers, pitch decks, social media posts, and conference banners. Working well as background for product pages, case studies, training materials, and marketing campaigns explaining analytics, machine learning pipelines, or system monitoring. Allowing color and overlay customization to match brand palette and layout needs.
Powered by 


downloads
Tags:
More
Credit Photo
If you would like to credit the Photo, here are some ways you can do so
Text Link
photo Link
<span class="text-link">
<span>
<a target="_blank" href=https://pikwizard.com/photo/displaying-time-series-analytics-waveform-over-javascript-code-with-futuristic-radar/ef6b4088f9452f8f25d185ddc27b81a6/>PikWizard</a>
</span>
</span>
<span class="image-link">
<span
style="margin: 0 0 20px 0; display: inline-block; vertical-align: middle; width: 100%;"
>
<a
target="_blank"
href="https://pikwizard.com/photo/displaying-time-series-analytics-waveform-over-javascript-code-with-futuristic-radar/ef6b4088f9452f8f25d185ddc27b81a6/"
style="text-decoration: none; font-size: 10px; margin: 0;"
>
<img src="https://pikwizard.com/pw/medium/ef6b4088f9452f8f25d185ddc27b81a6.jpg" style="margin: 0; width: 100%;" alt="" />
<p style="font-size: 12px; margin: 0;">PikWizard</p>
</a>
</span>
</span>
Free (free of charge)
Free for personal and commercial use.
Author: Authentic Images
Similar Free Stock Images

Premium


AI


Premium


AI


Premium


Premium


Premium


Premium
Premium


Premium

Premium


Premium


Premium


Premium


Premium
Premium

Premium


Premium


Premium


Premium

Premium


Premium


Premium


Premium


Premium


Premium


Premium


Explore More Free Stock Images