- Home >
- Stock Photos >
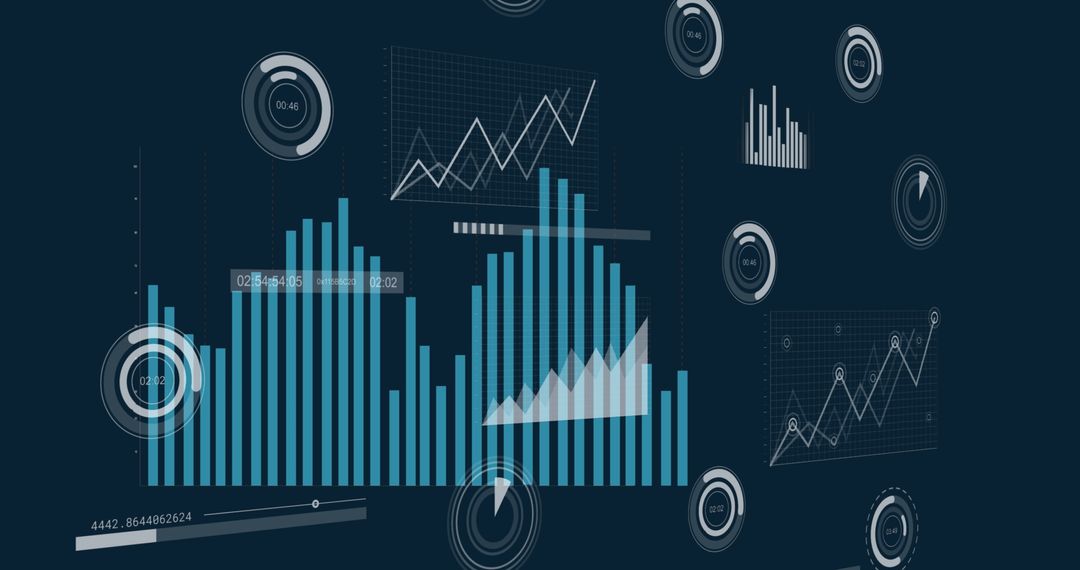
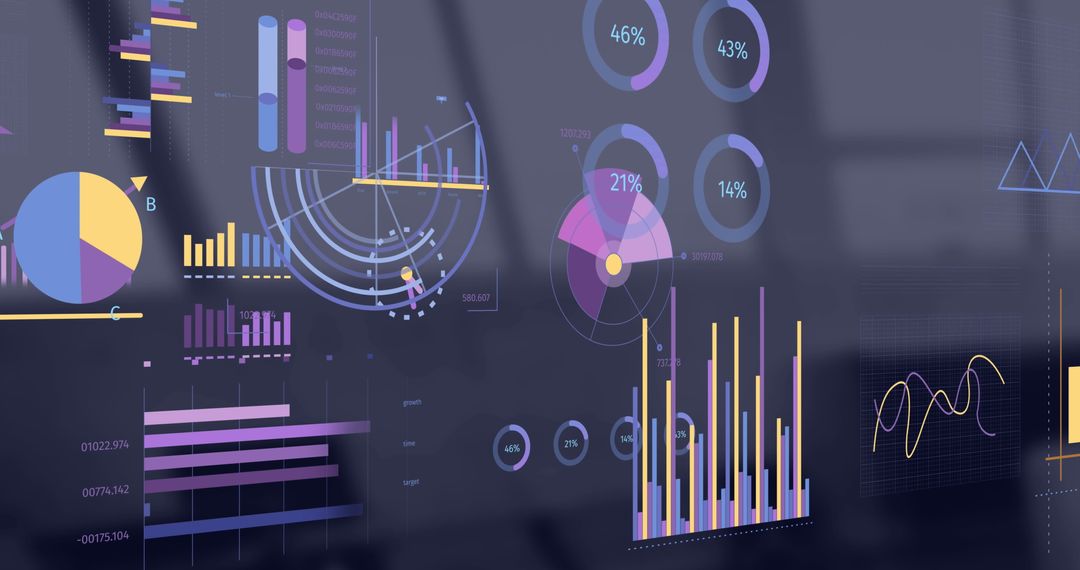
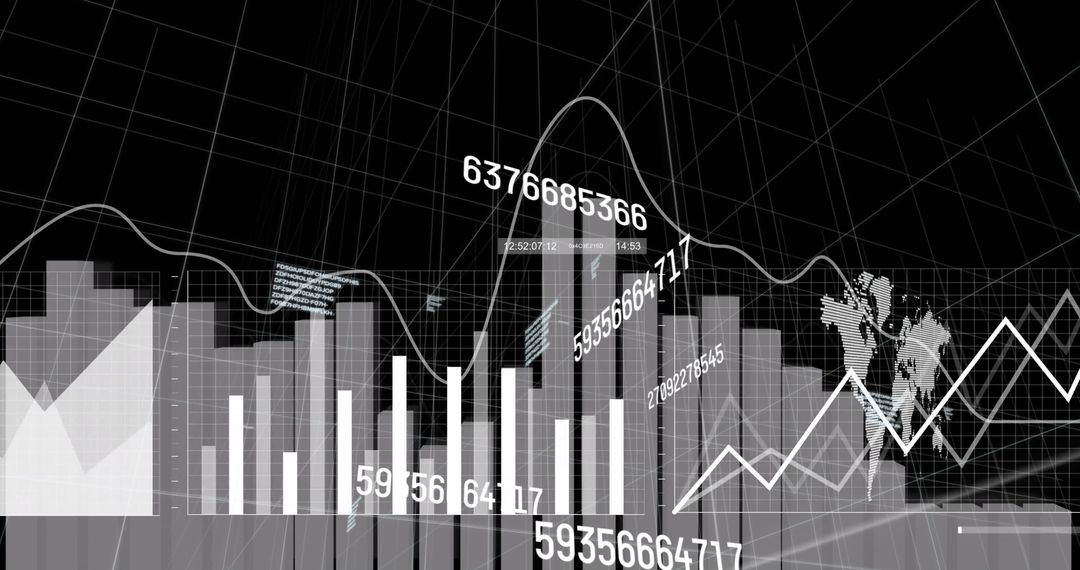
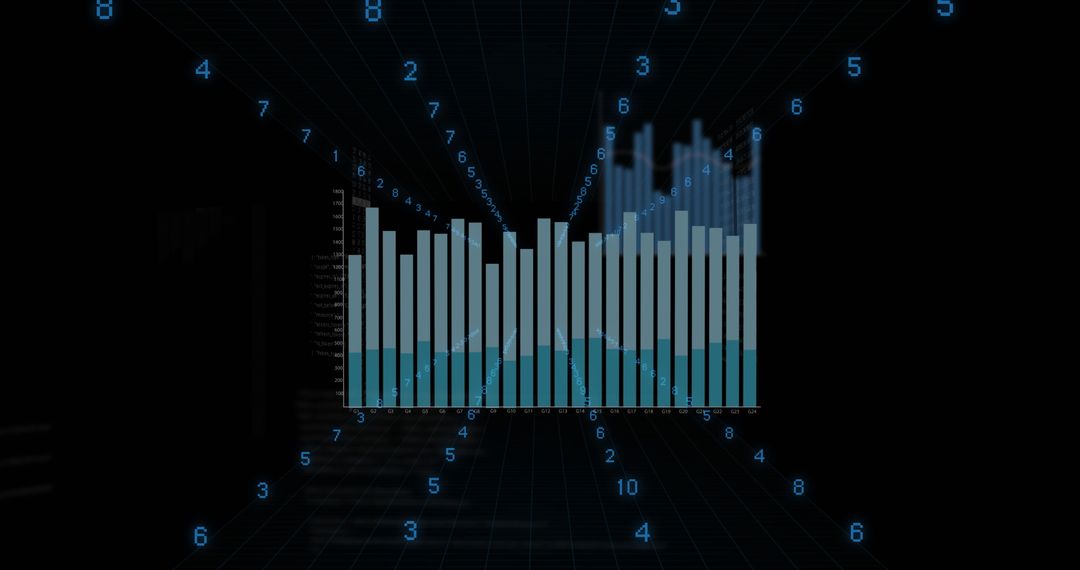
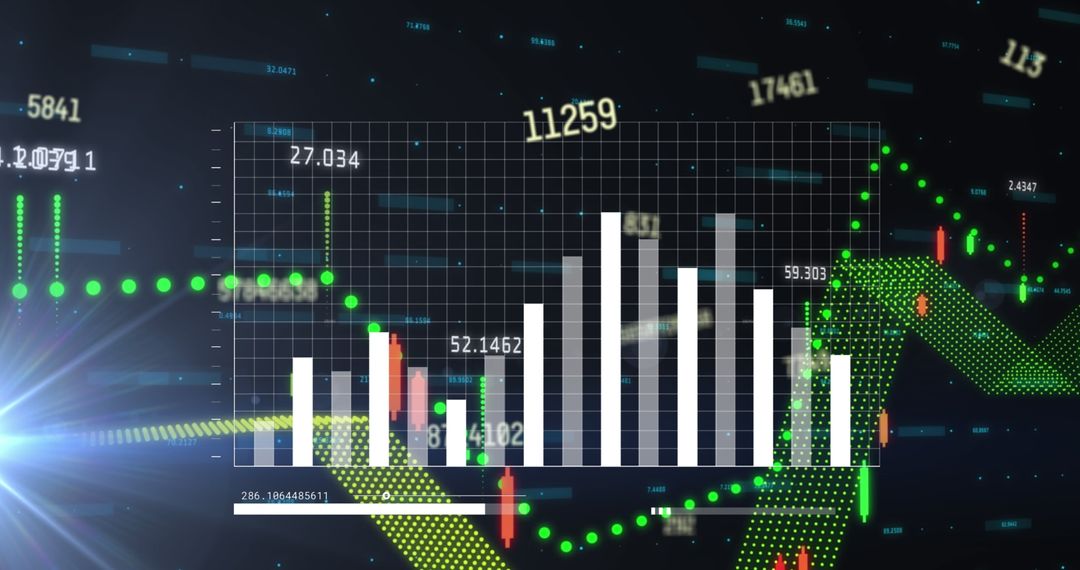
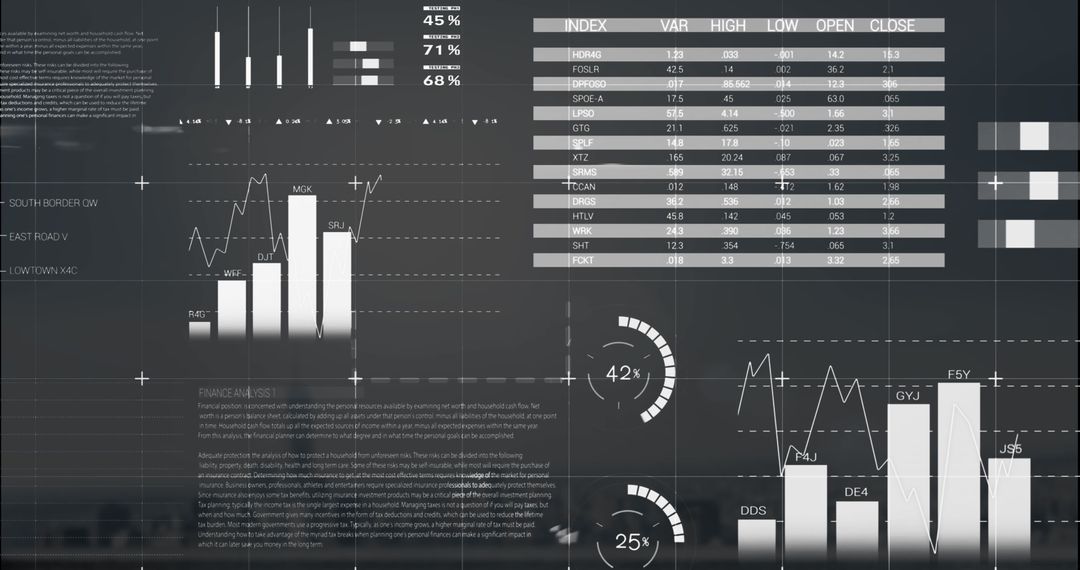
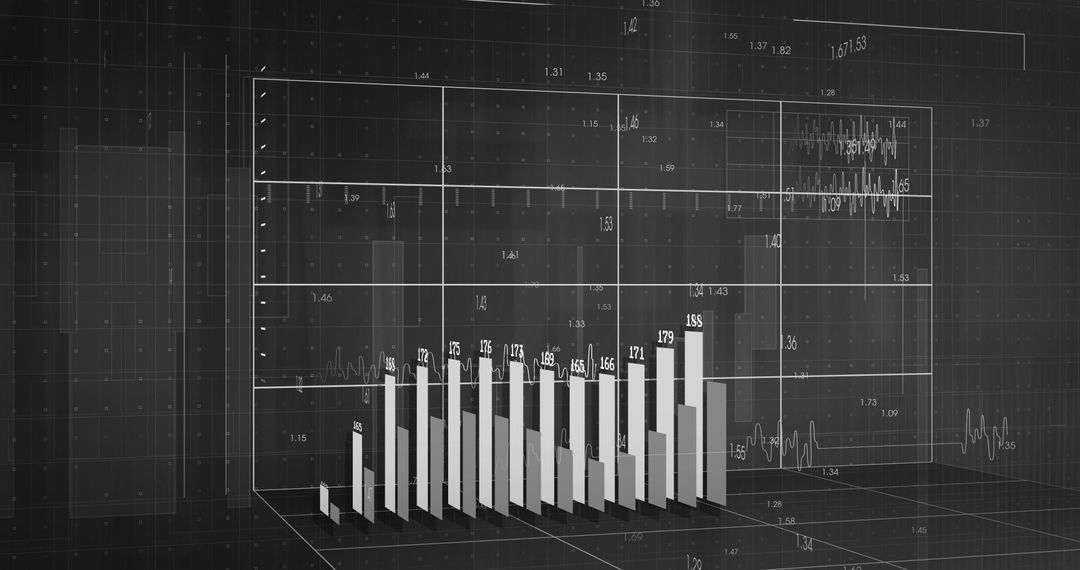
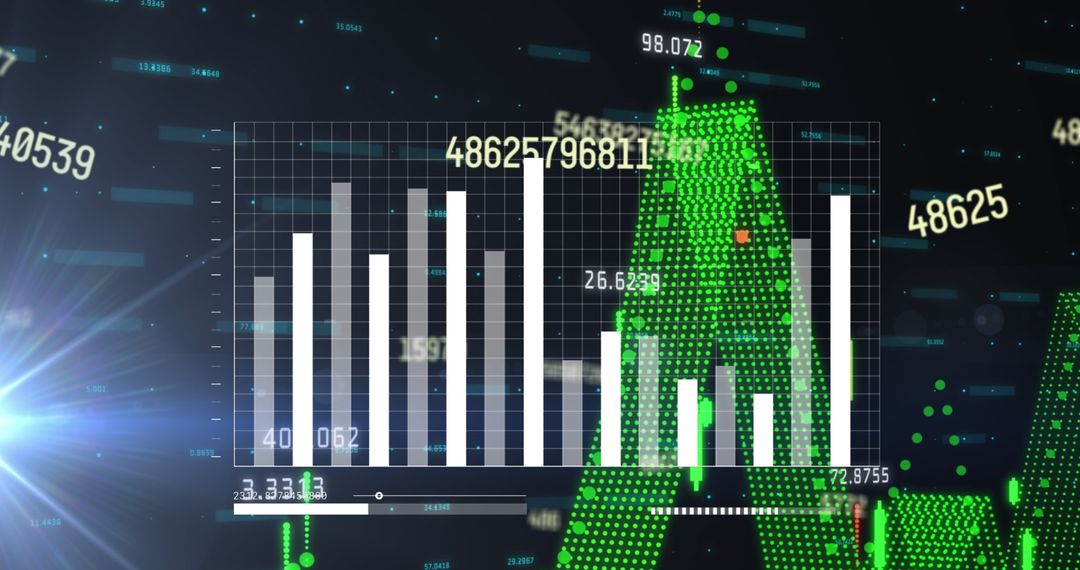
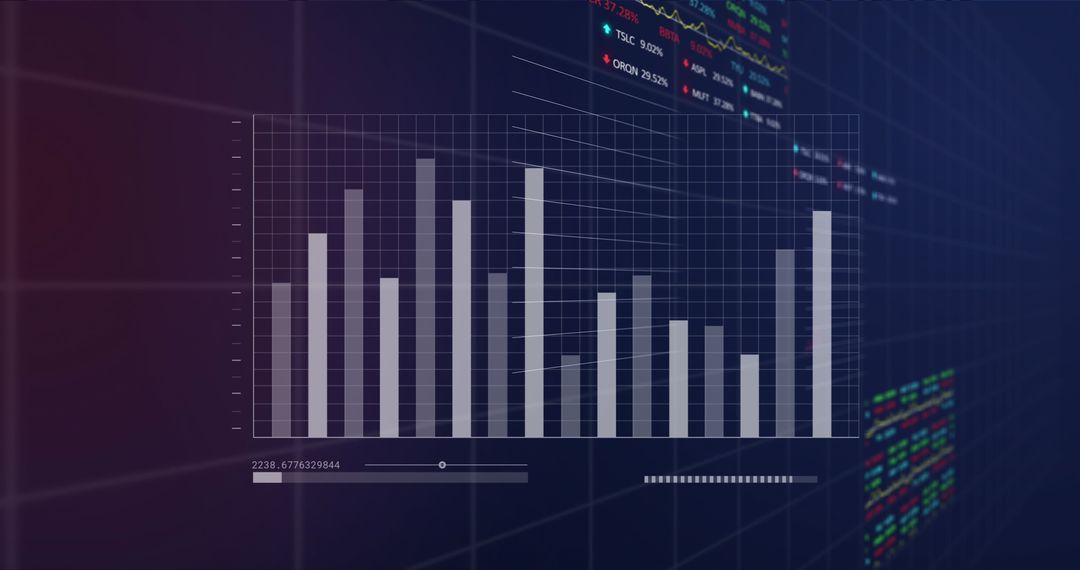
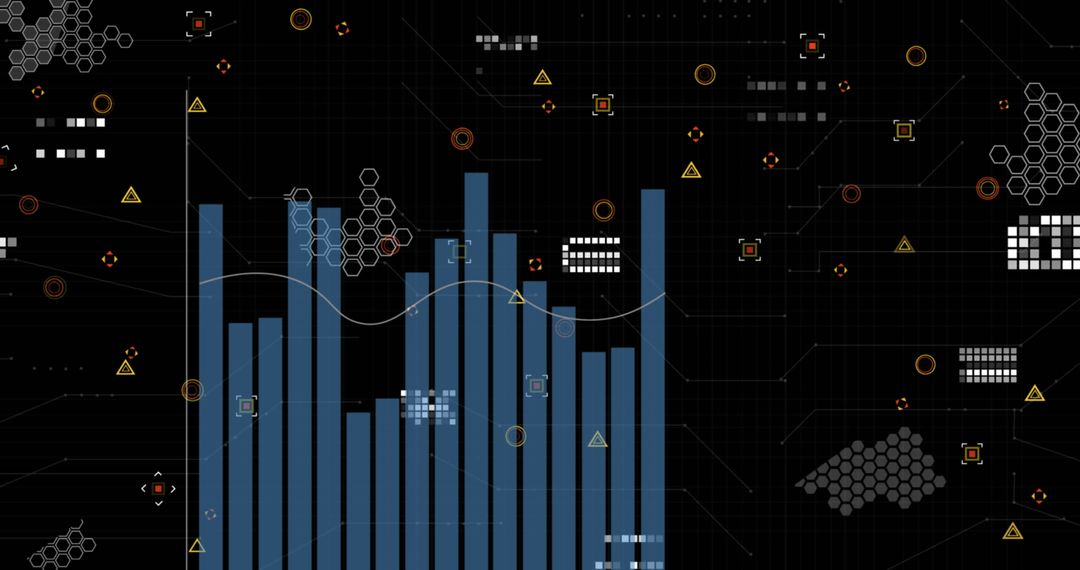
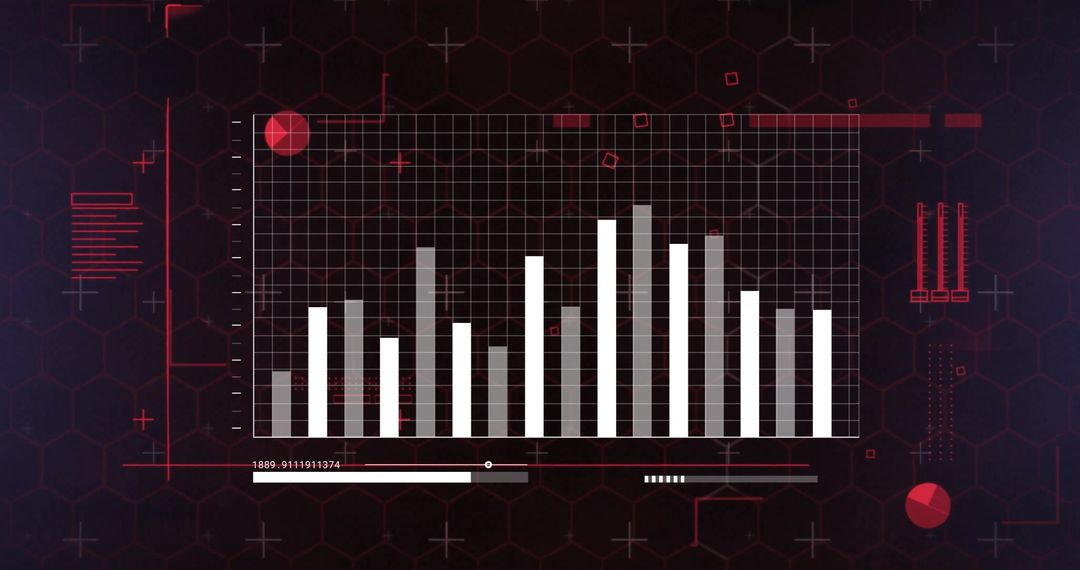
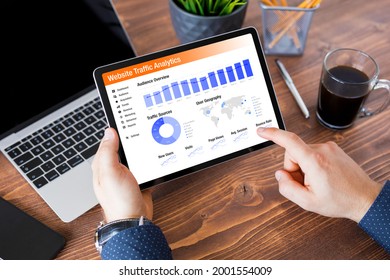
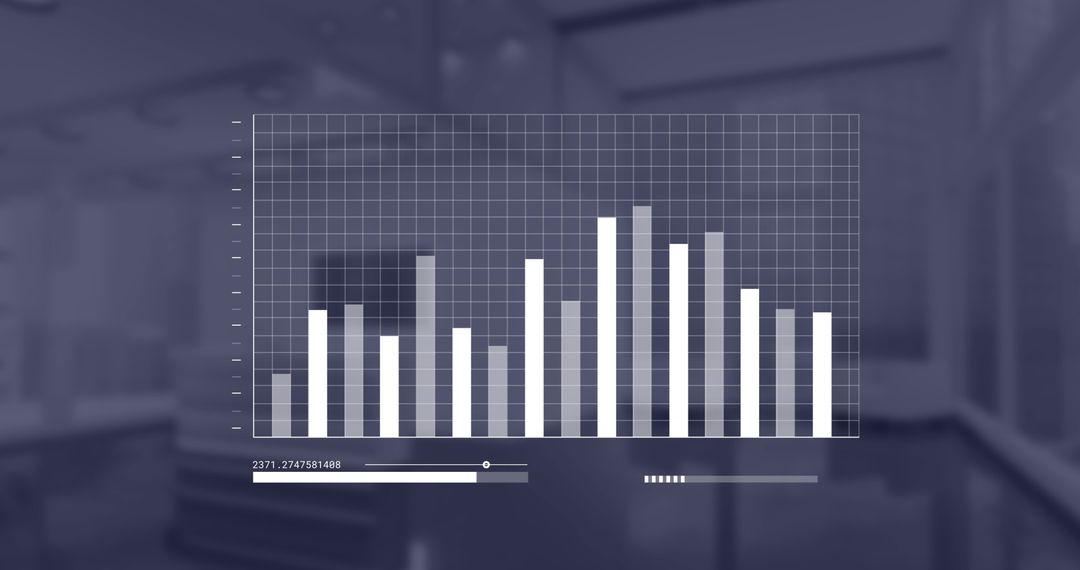
- Displaying vertical bar chart dashboard with orange callouts on dark analytics grid
Displaying vertical bar chart dashboard with orange callouts on dark analytics grid Image
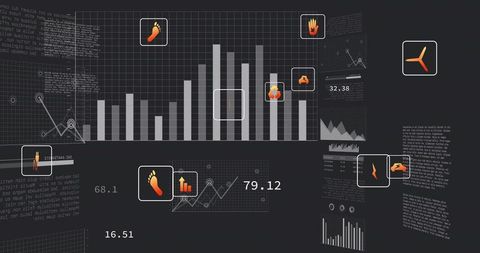
Dark grid dashboard displaying vertical bar chart with glowing orange callouts, overlaid line charts, numeric readouts, and icon markers. Muted gray bars and bright orange accents creating clear visual contrast for highlighting key metrics. Clean modern composition suitable for conveying data-driven insights, KPI tracking, market trends, and performance analysis. Use for website hero banners, presentation slides, investor reports, blog headers, pitch decks, product landing pages, UI design mockups, and social media campaigns. Combine with bold headlines and concise statistic overlays for marketing materials, corporate analytics reports, fintech presentations, or technology case studies. Color palette and iconography supporting themes of monitoring, forecasting, and strategic decision making.
Powered by  - Get 15% off with code: PIKWIZARD15


0
downloads
downloads
Tags:
More
Credit Photo
If you would like to credit the Photo, here are some ways you can do so
Text Link
photo Link
<span class="text-link">
<span>
<a target="_blank" href=https://pikwizard.com/photo/displaying-vertical-bar-chart-dashboard-with-orange-callouts-on-dark-analytics-grid/8a44ed1783eeed57641998056d63384d/>PikWizard</a>
</span>
</span>
<span class="image-link">
<span
style="margin: 0 0 20px 0; display: inline-block; vertical-align: middle; width: 100%;"
>
<a
target="_blank"
href="https://pikwizard.com/photo/displaying-vertical-bar-chart-dashboard-with-orange-callouts-on-dark-analytics-grid/8a44ed1783eeed57641998056d63384d/"
style="text-decoration: none; font-size: 10px; margin: 0;"
>
<img src="https://pikwizard.com/pw/medium/8a44ed1783eeed57641998056d63384d.jpg" style="margin: 0; width: 100%;" alt="" />
<p style="font-size: 12px; margin: 0;">PikWizard</p>
</a>
</span>
</span>
Free (free of charge)
Free for personal and commercial use.
Author: Awesome Content
Similar Free Stock Images
Premium


Premium


Premium


Premium

Premium


Premium


Premium


Premium


Premium


Premium


Premium


Premium


Premium


Premium

Premium


Premium


Premium

Premium


Premium


Premium


Premium


Premium

Premium


Premium