- Home >
- Stock Photos >
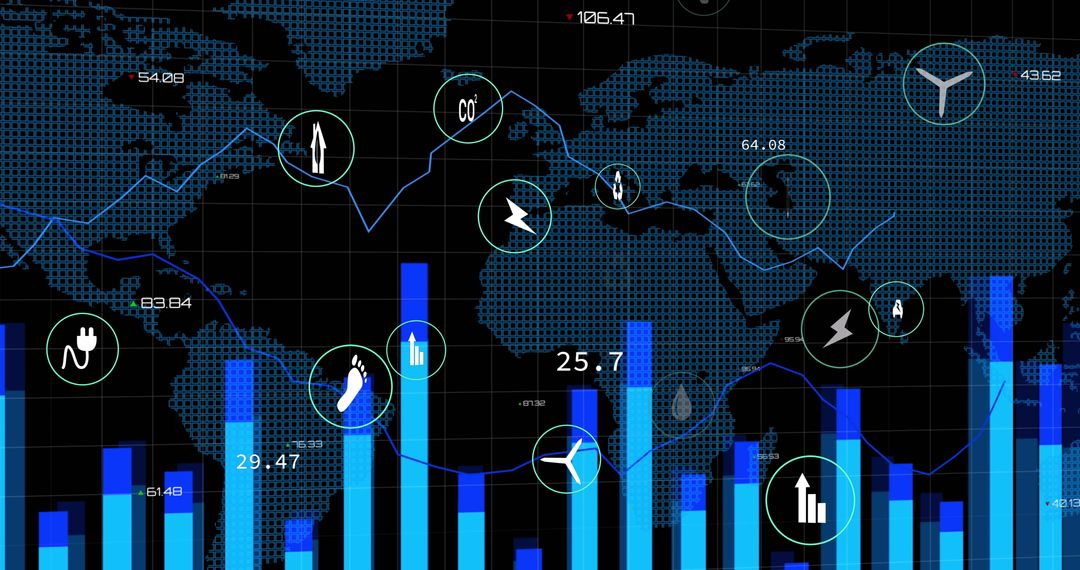
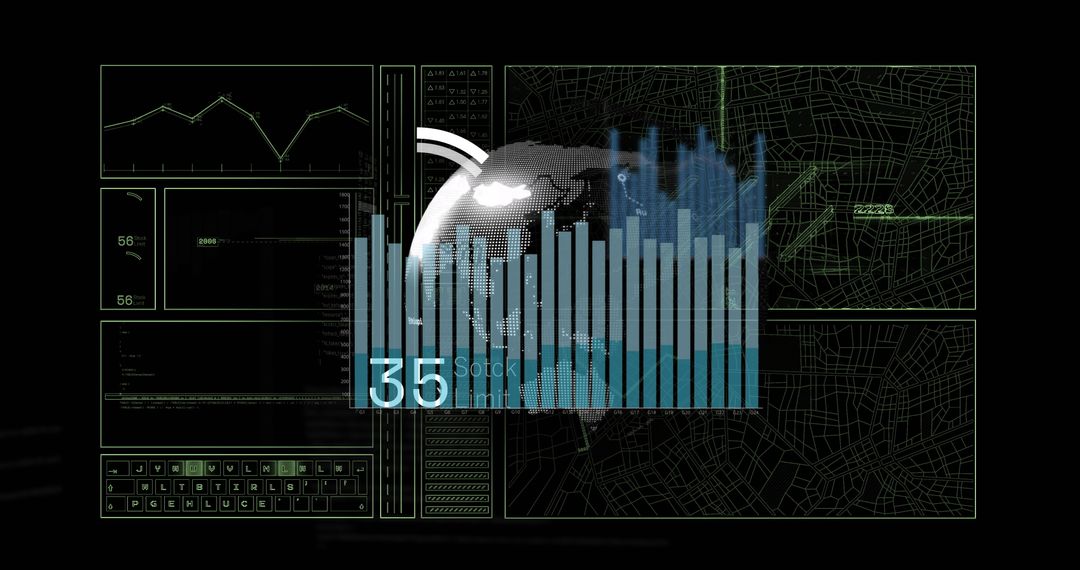
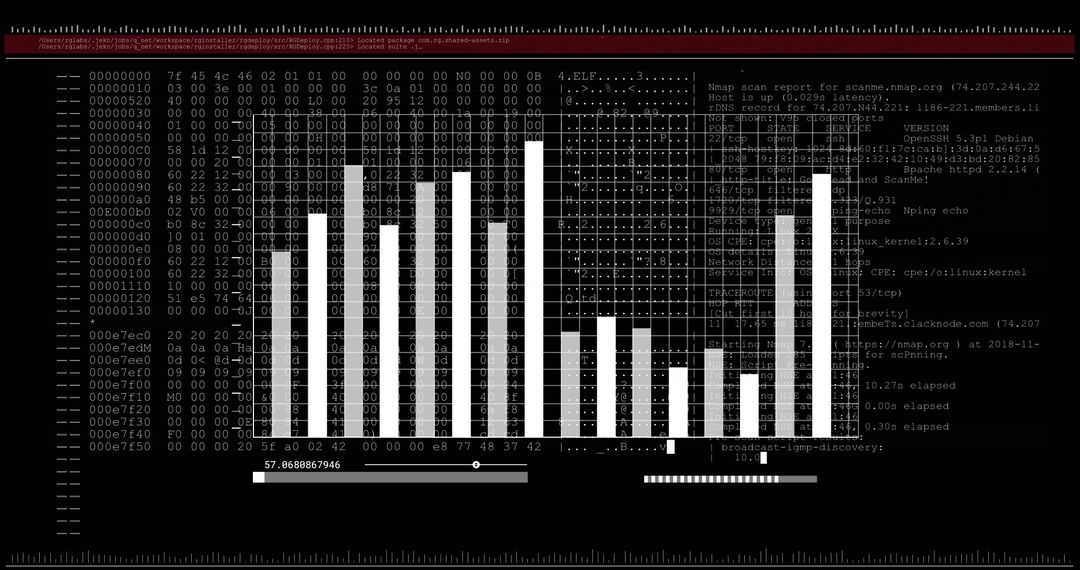
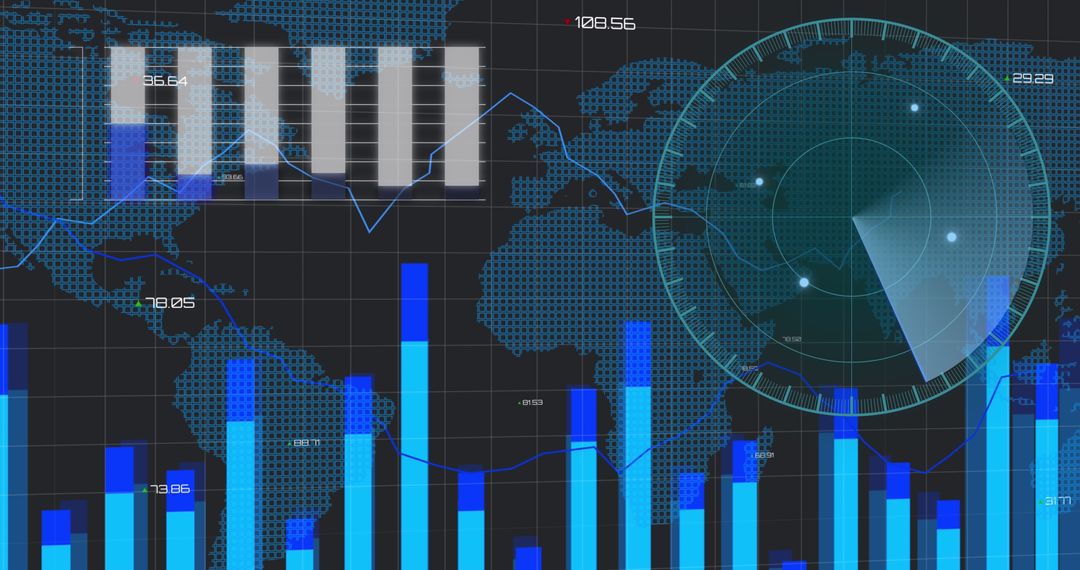
- Diverse Graphs Depicting Global Financial Data on Black Background
Diverse Graphs Depicting Global Financial Data on Black Background Image
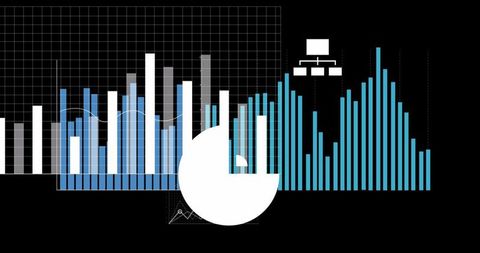
This illustration shows diverse graphs and charts to represent financial data against a contrasting black background, highlighting global economic concepts. The use of varied graphical elements like bar charts, line graphs, and pie charts emphasizes the complexity and interconnectivity of financial analytics. Ideal for articles about global market trends, financial seminars, economic reports, or presentations revolving around economics and business strategies.
Powered by  - Get 15% off with code: PIKWIZARD15


2
downloads
downloads
Tags:
More
Credit Photo
If you would like to credit the Photo, here are some ways you can do so
Text Link
photo Link
<span class="text-link">
<span>
<a target="_blank" href=https://pikwizard.com/photo/diverse-graphs-depicting-global-financial-data-on-black-background/b0b9074523b3c9944475f3a23af2ef9b/>PikWizard</a>
</span>
</span>
<span class="image-link">
<span
style="margin: 0 0 20px 0; display: inline-block; vertical-align: middle; width: 100%;"
>
<a
target="_blank"
href="https://pikwizard.com/photo/diverse-graphs-depicting-global-financial-data-on-black-background/b0b9074523b3c9944475f3a23af2ef9b/"
style="text-decoration: none; font-size: 10px; margin: 0;"
>
<img src="https://pikwizard.com/pw/medium/b0b9074523b3c9944475f3a23af2ef9b.jpg" style="margin: 0; width: 100%;" alt="" />
<p style="font-size: 12px; margin: 0;">PikWizard</p>
</a>
</span>
</span>
Free (free of charge)
Free for personal and commercial use.
Author: Authentic Images
Similar Free Stock Images
Premium


Premium


Premium


Premium


Premium


Premium


Premium


Premium


Premium


Premium


Premium


Premium


Premium


Premium


Premium


Premium


Premium


Premium


Premium


Premium


Premium


Premium


Premium


Premium